MATLAB: An Introduction with Applications
6th Edition
ISBN: 9781119256830
Author: Amos Gilat
Publisher: John Wiley & Sons Inc
expand_more
expand_more
format_list_bulleted
Question

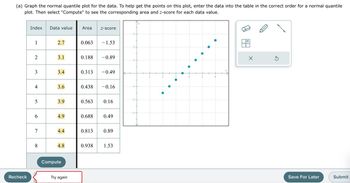
Transcribed Image Text:(a) Graph the normal quantile plot for the data. To help get the points on this plot, enter the data into the table in the correct order for a normal quantile
plot. Then select "Compute" to see the corresponding area and z-score for each data value.
Recheck
Index
1
2
3
4
5
6
7
8
Data value
2.7
3.1
3.4
3.6
3.9
4.9
4.4
4.8
Compute
Try again
Area
0.063
0.188
0.313
0.438
Z-score
- 1.53
-0.89
0.938
-0.49
-0.16
0.563 0.16
0.688 0.49
0.813 0.89
1.53
X
5
Save For Later
Submit

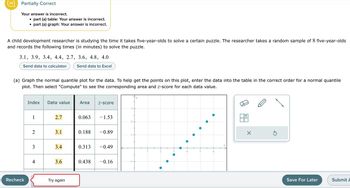
Transcribed Image Text:Partially Correct
Your answer is incorrect.
●
●
part (a) table: Your answer is incorrect.
part (a) graph: Your answer is incorrect.
A child development researcher is studying the time it takes five-year-olds to solve a certain puzzle. The researcher takes a random sample of 8 five-year-olds
and records the following times (in minutes) to solve the puzzle.
Recheck
3.1, 3.9, 3.4, 4.4, 2.7, 3.6, 4.8, 4.0
Send data to calculator
Send data to Excel
(a) Graph the normal quantile plot for the data. To help get the points on this plot, enter the data into the table in the correct order for a normal quantile
plot. Then select "Compute" to see the corresponding area and z-score for each data value.
Index Data value Area Z-score
1
2
3
4
2.7
3.1
3.4
3.6
Try again
0.063
- 1.53
0.188 -0.89
0.313 -0.49
0.438 -0.16
X
S
Save For Later
Submit A
Expert Solution
This question has been solved!
Explore an expertly crafted, step-by-step solution for a thorough understanding of key concepts.
This is a popular solution
Trending nowThis is a popular solution!
Step by stepSolved in 3 steps with 9 images

Knowledge Booster
Similar questions
- Brand A vitamins 505 506 502 S04 503 S01 S00 497 198 amount of Vitamin C in each pill was measured and plotted. From this dot plot, find the median, quartiles, and interquartile range: 494 196 495 40 samples of Vitamin C pills were 493 492 Milligrams of vitamin C taken from bottles of Brand A and the Quartile 1: Median: Quartile 3: Interquartile Range: 507 0odso 00od 000od 00odarrow_forwardWhich country of origin appears to have the highest “typical” miles per gallon? [ Select ] ["USA", "Sweden", "France", "Japan", "Italy", "Germany"] Which country of origin has the most variation in miles per gallon? [ Select ] ["Sweden", "USA", "France", "Italy", "Japan", "Germany"]arrow_forwardThe following data are the maximum temperatures (in degrees Fahrenheit) of 17 cities in the United states measured on the same day. 53 70 65 74 85 76 84 70 61 59 54 66 56 71 81 73 76 Construct a box and whisker plot for the data.arrow_forward
- For major league baseball teams, is there a relationship between player payrolls and gate money? Here are data for each of the American League teams for the year 2000. The variable x denotes the 2000 player payroll (in millions of dollars), and the variable y denotes the mean attendance (in thousands of fans) for the 81 home games that year. The data are plotted in the Figure 1 scatter plot. Also given is the product of the player payroll and the mean attendance for each of the fourteen teams. (These products, written in the column labelled "xy", may aid in calculations.) Anaheim Baltimore Boston Chicago White Sox Cleveland Detroit Kansas City Minnesota Mean Player payroll, x attendance, y (in $1,000,000s) thousands) New York Yankees Oakland Seattle Tampa Bay Texas Toronto Send data to calculator 59.2 80.5 97.0 42.3 90.5 68.6 31.8 23.5 114.3 43.0 69.9 65.2 72.7 66.8 25.56 40.74 31.98 24.07 42.72 31.23 20.74 13.09 39.88 21.36 38.89 18.27 34.57 22.47 xy x 1513.152 3279.57 3102.06…arrow_forwardFor the following example indicate the type of data involved using the following: A = nominal data B = ordinal data C = interval data 1. Number of patients with coronary pathology in nursing homes in the U.Sarrow_forwardH.W: Find forward and backward differences tables for the following data: 1. (1,0), (2,5), (3,22), (4,57), (5,116) 2. (10,0.9848), (20,0.9397), (30,0.866), (40,0.766), (50,0.6427) 3. (1,0), (1.5,0.176), (2,0.301), (2.5,0.398), (3,0.477), (3.5,0.544)arrow_forward
- The table below shows the number of state-registered automatic weapons and the murder rate for several Northwestern states. 11.8 8.2 6.9 3.6 2.5 2.8 2.6 0.4 14 11.3 10.2 7.4 6.5 6.3 5.9 4.5 x thousands of automatic weapons y = murders per 100,000 residents This data can be modeled by the equationý = 0.85x + 4.12. Use this equation to answer the following; %D A) How many murders per 100,000 residents can be expected in a state with 7.3 thousand automatic weapons? Answer = Nearest whole value. B) How many murders per 100,000 residents can be expected in a state with 1 thousand automatic weapons? Nearest whole value Answer =arrow_forwardThe following data are the scores of 19 students on an algebra test. 62 , 84 , 87 , 92 , 55 , 75 , 85 , 63 , 58 , 70 , 60 , 86 , 95 , 61 , 92 , 65 , 84 , 75 , 64 Send data to calculator Send data to Excel Using the tool provided, construct a box-and-whisker plot (sometimes called a boxplot) for the data. 55 60 65 70 75 80 85 90 95 Score on algebra testarrow_forwardFor the given data set: 12 11 19 10 7 15 13 2 Part 1 of 6 (a) Draw a scatter plot. I8- 14- 10+ 4. 10 12 14 Part: 1/6 Part 2 of 6 (b) Find the value for r. Round your answer to at least three decimal places.arrow_forward
- Find the new data point (x,y) in which x=2 from the data points (1.3) and (4.12)arrow_forwardPlease give maximum value for this data!arrow_forwardWhat are the most likely values of r for each plot of data shown below? Figure 1 *AT THE TOP r = -0.5 r = 0 r= 0.5 r = 1 ? Answer: Figure 2 *AT THE Bottom r = -0.5 r = 0 r= 0.5 r = 1 ? Answer:arrow_forward
arrow_back_ios
arrow_forward_ios
Recommended textbooks for you
 MATLAB: An Introduction with ApplicationsStatisticsISBN:9781119256830Author:Amos GilatPublisher:John Wiley & Sons Inc
 Probability and Statistics for Engineering and th...StatisticsISBN:9781305251809Author:Jay L. DevorePublisher:Cengage Learning
 Statistics for The Behavioral Sciences (MindTap C...StatisticsISBN:9781305504912Author:Frederick J Gravetter, Larry B. WallnauPublisher:Cengage Learning
 Elementary Statistics: Picturing the World (7th E...StatisticsISBN:9780134683416Author:Ron Larson, Betsy FarberPublisher:PEARSON
 The Basic Practice of StatisticsStatisticsISBN:9781319042578Author:David S. Moore, William I. Notz, Michael A. FlignerPublisher:W. H. Freeman
 Introduction to the Practice of StatisticsStatisticsISBN:9781319013387Author:David S. Moore, George P. McCabe, Bruce A. CraigPublisher:W. H. Freeman

MATLAB: An Introduction with Applications
Statistics
ISBN:9781119256830
Author:Amos Gilat
Publisher:John Wiley & Sons Inc

Probability and Statistics for Engineering and th...
Statistics
ISBN:9781305251809
Author:Jay L. Devore
Publisher:Cengage Learning

Statistics for The Behavioral Sciences (MindTap C...
Statistics
ISBN:9781305504912
Author:Frederick J Gravetter, Larry B. Wallnau
Publisher:Cengage Learning

Elementary Statistics: Picturing the World (7th E...
Statistics
ISBN:9780134683416
Author:Ron Larson, Betsy Farber
Publisher:PEARSON

The Basic Practice of Statistics
Statistics
ISBN:9781319042578
Author:David S. Moore, William I. Notz, Michael A. Fligner
Publisher:W. H. Freeman

Introduction to the Practice of Statistics
Statistics
ISBN:9781319013387
Author:David S. Moore, George P. McCabe, Bruce A. Craig
Publisher:W. H. Freeman