
MATLAB: An Introduction with Applications
6th Edition
ISBN: 9781119256830
Author: Amos Gilat
Publisher: John Wiley & Sons Inc
expand_more
expand_more
format_list_bulleted
Related questions
Question
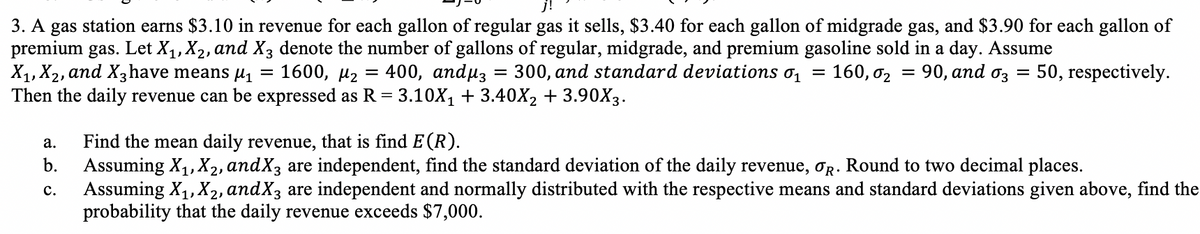

Transcribed Image Text:3. A gas station earns $3.10 in revenue for each gallon of regular gas it sells, $3.40 for each gallon of midgrade gas, and $3.90 for each gallon of
premium gas. Let X1, X2, and X3 denote the number of gallons of regular, midgrade, and premium gasoline sold in a day. Assume
X1, X2, and X3 have means µ1
Then the daily revenue can be expressed as R = 3.10X, + 3.40X2 + 3.90X3.
1600, µ2 =
400, аnduз
= 300, and standard deviations o, =
160, o2
%3D 90, аnd
03
50, respectively.
Find the mean daily revenue, that is find E(R).
Assuming X1, X2, andX3 are independent, find the standard deviation of the daily revenue, oR. Round to two decimal places.
Assuming X1, X2, andX3 are independent and normally distributed with the respective means and standard deviations given above, find the
probability that the daily revenue exceeds $7,000.
а.
b.
с.
Expert Solution
This question has been solved!
Explore an expertly crafted, step-by-step solution for a thorough understanding of key concepts.

This is a popular solution

Trending nowThis is a popular solution!

Step by stepSolved in 3 steps with 3 images

Knowledge Booster


Learn more about
Need a deep-dive on the concept behind this application? Look no further. Learn more about this topic, statistics and related others by exploring similar questions and additional content below.Similar questions
- ZB = %3D ZA = %3D AB=arrow_forwardDetermine the value of the constant k, such that 8 4 Sdx = 1.90038. 2x-1 k Give your answer correct to 3 decimal place. k=arrow_forwardAt the stadium, there are three lines for arriving customers, each staffed by a single worker. The arrival rate for customers is 140 per minute and each customer takes (on average) 1.1 seconds for a worker to process. The coefficient of variation for arrival time is 1.4 and the coefficient of variation for service time is 1. (Round your answerto three decimal places.) How much time (in seconds will an average customer spend in queue? secondsarrow_forward
- Each row represents an experimental “run” (in this case, averaged sample of mango wine). Column A shows the run number; Column B shows the percentage of ethanol; Column C shows the amount of glycerol (in g/L); Column D shows the amount of acid (in g/L); Column E shows the temperature of the run (in °C); and Column F shows the pH of the run. Y represents Ethanol of mango wine. 1. Create a scatterplot of the ethanol data for all 20 runs a. Draw a graphical representation of the model that you chose to use. b. Comparing the model to your data, evaluate its fit in one or two sentences. (Not sure what this question is getting at. I've provided all the information given) c. Replace the generic Yi = β0 + ε with the information you have here. Please help. I have no idea what this even means or where to start. HERE is the attached dataset to start with; a b c d e f Run Ethanol Glycerol Acidity Temp pH 1 4.8 3.5 0.84 24 3.8 2 9.6…arrow_forwardAssume a varies directly as b². If b is doubled, how will it affect a. Explain your answer in detail and upload your solution. Upload Choose a File Question 7 The mass of the sun is approximately 2 x 1030 kilograms, and the mass of the Earth is approximately 6 x 1024 kilograms. How many more times greater is the mass of the sun than the mass of the Earth? Explain your answer in detail and upload your solution. Upload Choose a File Question 8 JAN 14 MacBook Airarrow_forwardWhich values should you plot to show a linear relationship? Month Population Log(population) 1 1400 3.146 2600 3.415 4700 3.672 4 9000 3.954 17000 4.230 6. 32000 4.505 2. 3. 寸 5.arrow_forward
arrow_back_ios
arrow_forward_ios
Recommended textbooks for you
- MATLAB: An Introduction with ApplicationsStatisticsISBN:9781119256830Author:Amos GilatPublisher:John Wiley & Sons Inc
 Probability and Statistics for Engineering and th...StatisticsISBN:9781305251809Author:Jay L. DevorePublisher:Cengage Learning
 Statistics for The Behavioral Sciences (MindTap C...StatisticsISBN:9781305504912Author:Frederick J Gravetter, Larry B. WallnauPublisher:Cengage Learning
  Elementary Statistics: Picturing the World (7th E...StatisticsISBN:9780134683416Author:Ron Larson, Betsy FarberPublisher:PEARSON
 The Basic Practice of StatisticsStatisticsISBN:9781319042578Author:David S. Moore, William I. Notz, Michael A. FlignerPublisher:W. H. Freeman
 Introduction to the Practice of StatisticsStatisticsISBN:9781319013387Author:David S. Moore, George P. McCabe, Bruce A. CraigPublisher:W. H. Freeman
MATLAB: An Introduction with Applications
Statistics
ISBN:9781119256830
Author:Amos Gilat
Publisher:John Wiley & Sons Inc
Probability and Statistics for Engineering and th...
Statistics
ISBN:9781305251809
Author:Jay L. Devore
Publisher:Cengage Learning
Statistics for The Behavioral Sciences (MindTap C...
Statistics
ISBN:9781305504912
Author:Frederick J Gravetter, Larry B. Wallnau
Publisher:Cengage Learning
Elementary Statistics: Picturing the World (7th E...
Statistics
ISBN:9780134683416
Author:Ron Larson, Betsy Farber
Publisher:PEARSON
The Basic Practice of Statistics
Statistics
ISBN:9781319042578
Author:David S. Moore, William I. Notz, Michael A. Fligner
Publisher:W. H. Freeman
Introduction to the Practice of Statistics
Statistics
ISBN:9781319013387
Author:David S. Moore, George P. McCabe, Bruce A. Craig
Publisher:W. H. Freeman