
MATLAB: An Introduction with Applications
6th Edition
ISBN: 9781119256830
Author: Amos Gilat
Publisher: John Wiley & Sons Inc
expand_more
expand_more
format_list_bulleted
Related questions
Question
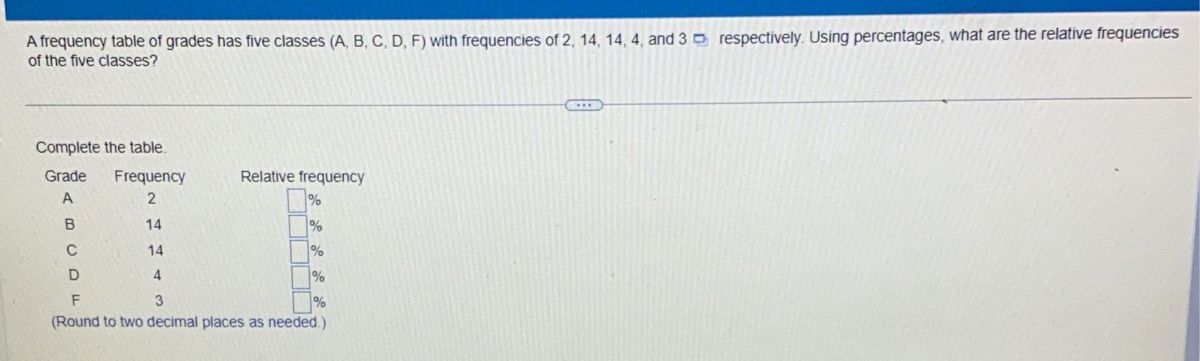

Transcribed Image Text:A frequency table of grades has five classes (A, B, C, D, F) with frequencies of 2, 14, 14, 4, and 3 D respectively. Using percentages, what are the relative frequencies
of the five classes?
Complete the table.
Grade
Frequency
Relative frequency
%
14
%
C
14
4
%
3
(Round to two decimal places as needed)

Transcribed Image Text:A frequency table of grades has five classes (A, B, C, D, F) with frequencies of 2, 14, 14, 4, and 3 respectively. Using percentages, what are the relative frequencies
of the five classes?
...
Complete the table.
Grade
Frequency
Relative frequency
14
%
C
14
4.
%
F
3.
%
(Round to two decimal places as needed.)
Expert Solution
This question has been solved!
Explore an expertly crafted, step-by-step solution for a thorough understanding of key concepts.

This is a popular solution

Trending nowThis is a popular solution!

Step by stepSolved in 2 steps with 2 images

Knowledge Booster

Similar questions
- Data Table for Wins and Losses The accompanying table shows data for the number of wins and losses in the Major League for 2017. Complete parts a and b below. E Click the icon to view the data table. Team Wins (ESPN) Losses (ESPN) Arizona Diamondbacks 93 69 a. Find the percentile rank for the wins by the San Diego Padres. Atlanta Braves 72 90 Baltimore Orioles 75 87 The percentile rank for the wins by the San Diego Padres is. (Round to one decimal place as needed.) Boston Red Sox Chicago Cubs Chicago White Sox 93 69 92 70 b. Find the percentile rank for the losses by the Pittsburgh Pirates. 67 95 Cincinnati Reds 68 94 The percentile rank for the losses by the Pittsburgh Pirates is Cleveland Indians 102 60 (Round to one decimal place as needed.) Colorado Rockies 87 75 Detroit Tigers 64 98 Houston Astros 101 61 Kansas City Royals Los Angeles Angels Los Angeles Dodgers 80 82 80 82 104 58 Miami Marlins 77 85 Milwaukee Brewers 86 76 Minnesota Twins 85 77 New York Mets 70 92 New York Yankees…arrow_forwardA Frequency table of grades has five classes (A, B, C, D, F) with frequencies of 4, 15, 16, 4 and 1 respectively. using percentages what other relative frequencies of the five classes?arrow_forwardDraw a pictograph to represent the data displayed in the table below. Choose whatever symbol you like and be sure to include a key with the scale that you used. Subject Number of Students Math 16 Science 8. English 12 History 8. Art 4 Subject Number of Students Math Science English History Art Key:arrow_forward
- The symbol p refers to percentage. O True O Falsearrow_forwardA restaurant recorded how many tacos were included in each order. This data is summarized in the histogram below. (Note: The last class actually represents "7 or more tacos," not just 7 tacos.) What is the proportion of times an order included at least 5 tacos? Round your answer to 3 decimal places.arrow_forwardStrictly homework not quiz thanks!arrow_forward
- The pie chart below shows percentages of grades of 700 students. A. 23% B. 27% C.33% D. 17%How many students have a grade of A?arrow_forward14arrow_forward50 part-time students were asked how many courses they were taking this term. The (incomplete) results are shown below: # of Courses Frequency Relative Frequency Cumulative Frequency 1 24 0.48 2 15 3 a. Complete the table.b. What percent of students take exactly one course? %arrow_forward
arrow_back_ios
SEE MORE QUESTIONS
arrow_forward_ios
Recommended textbooks for you
- MATLAB: An Introduction with ApplicationsStatisticsISBN:9781119256830Author:Amos GilatPublisher:John Wiley & Sons Inc
 Probability and Statistics for Engineering and th...StatisticsISBN:9781305251809Author:Jay L. DevorePublisher:Cengage Learning
 Statistics for The Behavioral Sciences (MindTap C...StatisticsISBN:9781305504912Author:Frederick J Gravetter, Larry B. WallnauPublisher:Cengage Learning
  Elementary Statistics: Picturing the World (7th E...StatisticsISBN:9780134683416Author:Ron Larson, Betsy FarberPublisher:PEARSON
 The Basic Practice of StatisticsStatisticsISBN:9781319042578Author:David S. Moore, William I. Notz, Michael A. FlignerPublisher:W. H. Freeman
 Introduction to the Practice of StatisticsStatisticsISBN:9781319013387Author:David S. Moore, George P. McCabe, Bruce A. CraigPublisher:W. H. Freeman
MATLAB: An Introduction with Applications
Statistics
ISBN:9781119256830
Author:Amos Gilat
Publisher:John Wiley & Sons Inc
Probability and Statistics for Engineering and th...
Statistics
ISBN:9781305251809
Author:Jay L. Devore
Publisher:Cengage Learning
Statistics for The Behavioral Sciences (MindTap C...
Statistics
ISBN:9781305504912
Author:Frederick J Gravetter, Larry B. Wallnau
Publisher:Cengage Learning
Elementary Statistics: Picturing the World (7th E...
Statistics
ISBN:9780134683416
Author:Ron Larson, Betsy Farber
Publisher:PEARSON
The Basic Practice of Statistics
Statistics
ISBN:9781319042578
Author:David S. Moore, William I. Notz, Michael A. Fligner
Publisher:W. H. Freeman
Introduction to the Practice of Statistics
Statistics
ISBN:9781319013387
Author:David S. Moore, George P. McCabe, Bruce A. Craig
Publisher:W. H. Freeman