
MATLAB: An Introduction with Applications
6th Edition
ISBN: 9781119256830
Author: Amos Gilat
Publisher: John Wiley & Sons Inc
expand_more
expand_more
format_list_bulleted
Related questions
Topic Video
Question
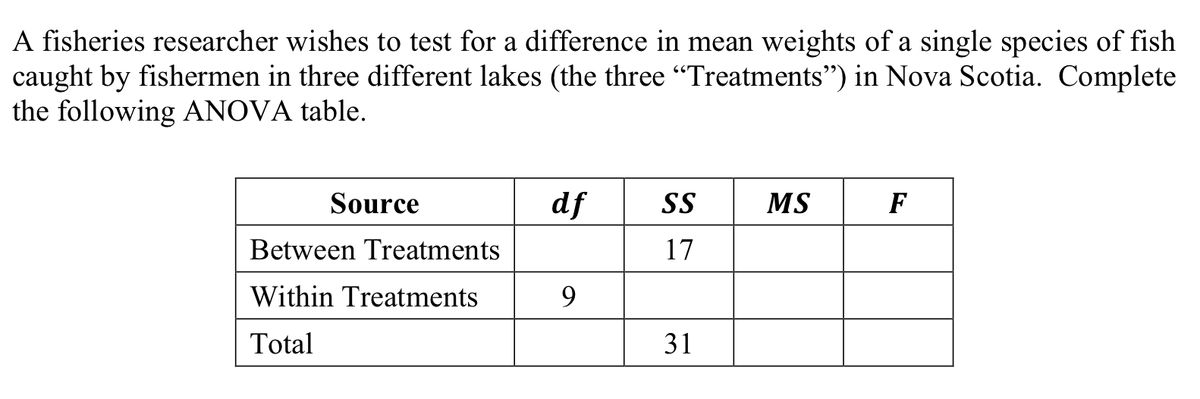

Transcribed Image Text:A fisheries researcher wishes to test for a difference in mean weights of a single species of fish
caught by fishermen in three different lakes (the three "Treatments") in Nova Scotia. Complete
the following ANOVA table.
Source
df
SS
MS
F
Between Treatments
17
Within Treatments
Total
31
Expert Solution
This question has been solved!
Explore an expertly crafted, step-by-step solution for a thorough understanding of key concepts.

This is a popular solution

Trending nowThis is a popular solution!

Step by stepSolved in 2 steps with 1 images

Knowledge Booster


Learn more about
Need a deep-dive on the concept behind this application? Look no further. Learn more about this topic, statistics and related others by exploring similar questions and additional content below.Similar questions
- A health professional is whether stress level before a routine practice session can be used to predict the mean stress level a major figure skating competition. The health professional selected a random sample of figure skaters and measured the stress level before a routine practice session and before a major competitionEach variable was measured as the change in the interval between heartbeats , or heart rate variability . The health professional wants to estimate the mean change in the stress level before a major competition for each unit increase in the stress level before a routine practice.arrow_forwardThe systolic blood pressure of individuals is thought to be related to both age and weight. Let the systolic blood pressure, age, and weight be represented by the variables x1, x2, and x3, respectively. Suppose that Minitab was used to generate the following descriptive statistics, correlations, and regression analysis for a random sample of 15 individuals. Descriptive Statistics Variable N Mean Median TrMean StDev SE Mean x1 15 158.42 158.72 158.42 3.127 0.807388 x2 15 65.95 66.45 65.95 1.091 0.281695 x3 15 187.23 186.63 187.23 4.171 1.076948 Variable Minimum Maximum Q1 Q3 x1 124 174 135.828 166.400 x2 41 80 47.088 77.579 x3 124 244 142.885 223.525 Correlations (Pearson) x1 x2 x2 0.829 x3 0.860 0.661 Regression Analysis The regression equation is x1 = 0.837 + 1.120x2 + 0.928x3 Predictor Coef StDev T P…arrow_forwardAll of the following are descriptive statistics EXCEPT a. independent samples t-testb. medianc. variance d. frequency tablesarrow_forward
- South Dakota prices vary $350,000: $400,000:$400,000:$425,000:$429,000: $440,000: $560,000: $585,000,: $585,000: $785,000 : $1,300,000. We found the following Mean = 569000 SD = 272703.1353 T score = .7113 P Value = .4932 CI: 385795.5409,752204.4591 If you had a margin of error of $13,000 how large of sample would you need with a 90% confidence interval using the given tscore.arrow_forwardWhat type of data would you use for collecting data on lap swim time?arrow_forwardExhibit 2 The management of a department store is interested in estimating the difference between the mean credit purchase of customers using the stores credit card versus those customers using a national major credit card. You are given the following information: STORES CARD MAJOR CREDIT CARD Sample Size 75 52 Sample Mean $185 $150 Sample Std Dev $12 $8 Q21a = Refer to Exhibit 2. A Point estimate for the difference between the mean purchases of the users of the two credit cards is:arrow_forward
- Students in an experimental psychology class did research on depression as a sign of stress. A test was administered to a sample of 30 students. The scores are given. Complete parts (a) through (c) below. 32 54 11 15 35 21 OA. 158 34 15 55 51 11 35 2 1457 3 1234567 4123445566 511245666 34 33 46 OB. 11155 (a) Find the mean and median of the data. The mean is . (Round to three decimal places as needed.) 44 26 27 The median is .(Type an integer or a decimal.) (b) Draw a stem-and-leaf plot for the data using one row per stem. Which stem-and-leaf plot below shows the data? 2 112677 3 233445556 4 244666 5 1456 ... 21 42 38 OA. The distribution is symmetric. B. The distribution is skewed right (positively skewed). OC. The distribution is skewed left (negatively skewed). O D. The distribution is uniform. (c) Describe the shape of the distribution. Which description below best describes the shape of the distribution? 56 46 OC. 1112455668 2 14556 3 15 4 13457 5 223446667 46 27 33 35 22 44 36 0…arrow_forwardQUESTION 3 What percent of scores are below an SAT score of 560?arrow_forwardA violin student records the number of hours they spend practicing during each of ten consecutive weeks. 2.5 3.5 3 2.4 What is the first quartile for this data? 3.6 7 8.1 5.4 7 4.1 8.6arrow_forward
arrow_back_ios
SEE MORE QUESTIONS
arrow_forward_ios
Recommended textbooks for you
- MATLAB: An Introduction with ApplicationsStatisticsISBN:9781119256830Author:Amos GilatPublisher:John Wiley & Sons Inc
 Probability and Statistics for Engineering and th...StatisticsISBN:9781305251809Author:Jay L. DevorePublisher:Cengage Learning
 Statistics for The Behavioral Sciences (MindTap C...StatisticsISBN:9781305504912Author:Frederick J Gravetter, Larry B. WallnauPublisher:Cengage Learning
  Elementary Statistics: Picturing the World (7th E...StatisticsISBN:9780134683416Author:Ron Larson, Betsy FarberPublisher:PEARSON
 The Basic Practice of StatisticsStatisticsISBN:9781319042578Author:David S. Moore, William I. Notz, Michael A. FlignerPublisher:W. H. Freeman
 Introduction to the Practice of StatisticsStatisticsISBN:9781319013387Author:David S. Moore, George P. McCabe, Bruce A. CraigPublisher:W. H. Freeman
MATLAB: An Introduction with Applications
Statistics
ISBN:9781119256830
Author:Amos Gilat
Publisher:John Wiley & Sons Inc
Probability and Statistics for Engineering and th...
Statistics
ISBN:9781305251809
Author:Jay L. Devore
Publisher:Cengage Learning
Statistics for The Behavioral Sciences (MindTap C...
Statistics
ISBN:9781305504912
Author:Frederick J Gravetter, Larry B. Wallnau
Publisher:Cengage Learning
Elementary Statistics: Picturing the World (7th E...
Statistics
ISBN:9780134683416
Author:Ron Larson, Betsy Farber
Publisher:PEARSON
The Basic Practice of Statistics
Statistics
ISBN:9781319042578
Author:David S. Moore, William I. Notz, Michael A. Fligner
Publisher:W. H. Freeman
Introduction to the Practice of Statistics
Statistics
ISBN:9781319013387
Author:David S. Moore, George P. McCabe, Bruce A. Craig
Publisher:W. H. Freeman