Structural Analysis
6th Edition
ISBN: 9781337630931
Author: KASSIMALI, Aslam.
Publisher: Cengage,
expand_more
expand_more
format_list_bulleted
Concept explainers
Question

Transcribed Image Text:### Structural Analysis of a Loaded Beam
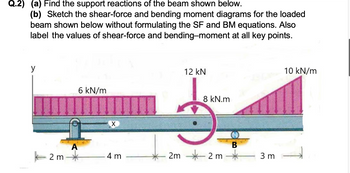
**Q.2) (a) Find the support reactions of the beam shown below.**
(b) Sketch the shear-force and bending moment diagrams for the loaded beam shown below without formulating the SF and BM equations. Also label the values of shear-force and bending-moment at all key points.**
**Beam Description:**
The beam is supported at two points, marked as A and B. The horizontal beam is subjected to various loads as follows:
- A uniformly distributed load (UDL) of 6 kN/m is applied over a length of 4 meters starting from the left end (between A and B).
- A point load of 12 kN acts downwards at a distance of 6 meters from the left end.
- A clockwise moment of 8 kN.m is applied at a point 8 meters from the left end.
- Another UDL that linearly increases from 0 kN/m to 10 kN/m over a length of 3 meters, starting at 7 meters from the left end.
**Dimensions:**
- Distance from the left end to support A: 2 meters
- Distance between supports A and B: 4 meters
- Distance from support B to the point where the linearly increasing UDL ends: 3 meters
**Diagram Descriptions:**
- A vertical y-axis and a horizontal x-axis are used for reference.
- The uniformly distributed load of 6 kN/m is visually depicted by arrows pointing downwards, distributed evenly between supports A and B.
- The 12 kN point load acts vertically downward with a distinct arrow at the specific location mentioned.
- The 8 kN.m moment is indicated with a curved arrow, showing the point of action and direction.
- The linearly increasing load is represented by a triangular shape, starting from 0 and peaking at 10 kN/m towards the end of the beam.
**Graphical Explanations:**
1. **Support Reactions:**
- The reactions at supports A and B act vertically upward to counterbalance the applied loads.
2. **Shear Force Diagram (SFD):**
- The shear force diagram would start from zero at the left end.
- It will linearly increase or decrease corresponding to the respective loads (UDL, point load, and moment).
- Key points where the shear force drastically changes should be marked and their values calculated.
Expert Solution
This question has been solved!
Explore an expertly crafted, step-by-step solution for a thorough understanding of key concepts.
Step by stepSolved in 5 steps with 5 images

Knowledge Booster
Learn more about
Need a deep-dive on the concept behind this application? Look no further. Learn more about this topic, civil-engineering and related others by exploring similar questions and additional content below.Similar questions
- Problem II. Solve the problem using Conjugate Beam Method. The beam shown has a constant El and is supported as shown. Find the following: 300 KN 15 kN/m a. Reaction at A (KN) slim 1.5 kNm b. Reaction at B (kN) B с c. Slope at C in radians 2m 10m d. Displacement at the application of 300kN load m | 3m | 3m tarrow_forwardQ.3) (a) Find the support reactions of the beam shown below. (b) Write the expressions for shear-force (V) and bending-moment (M) for a beam section between points C and D, as a function of x measured from the left-end support. 12 kN 6 kN 4 m 1 kN/m 2 kN/m D 1.5 kN/m 6 m A 1 m 2 m C 30% 3 m 20 kN.m B Aarrow_forward2.0 m ㅏ F 3.0 m q 4.0 m The above freely supported light uniform beam of length 10 m carries a point load F = 45 kN and a uniformly distributed load q = 23 kN m −1 at the positions indicated. Find the shear force V (x) and the bending moment M(x) at the following points along the beam. Give your answers correct to two significant figures. At the point x = 4 m the shear force and bending moment are: V(4) and M(4) = KN kN m. At the point x = : 8 m the shear force and bending moment are: KN = V(8) and M(8) = kN m 1.0 m + -+arrow_forward
arrow_back_ios
arrow_forward_ios
Recommended textbooks for you

 Structural Analysis (10th Edition)Civil EngineeringISBN:9780134610672Author:Russell C. HibbelerPublisher:PEARSON
 Principles of Foundation Engineering (MindTap Cou...Civil EngineeringISBN:9781337705028Author:Braja M. Das, Nagaratnam SivakuganPublisher:Cengage Learning
 Fundamentals of Structural AnalysisCivil EngineeringISBN:9780073398006Author:Kenneth M. Leet Emeritus, Chia-Ming Uang, Joel LanningPublisher:McGraw-Hill Education
 Traffic and Highway EngineeringCivil EngineeringISBN:9781305156241Author:Garber, Nicholas J.Publisher:Cengage Learning


Structural Analysis (10th Edition)
Civil Engineering
ISBN:9780134610672
Author:Russell C. Hibbeler
Publisher:PEARSON

Principles of Foundation Engineering (MindTap Cou...
Civil Engineering
ISBN:9781337705028
Author:Braja M. Das, Nagaratnam Sivakugan
Publisher:Cengage Learning

Fundamentals of Structural Analysis
Civil Engineering
ISBN:9780073398006
Author:Kenneth M. Leet Emeritus, Chia-Ming Uang, Joel Lanning
Publisher:McGraw-Hill Education


Traffic and Highway Engineering
Civil Engineering
ISBN:9781305156241
Author:Garber, Nicholas J.
Publisher:Cengage Learning