MATLAB: An Introduction with Applications
6th Edition
ISBN: 9781119256830
Author: Amos Gilat
Publisher: John Wiley & Sons Inc
expand_more
expand_more
format_list_bulleted
Question
please provide step by step solutions and no minitab and excel answers.
thanks

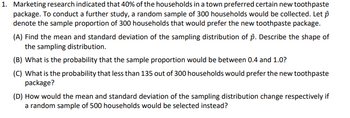
Transcribed Image Text:1. Marketing research indicated that 40% of the households in a town preferred certain new toothpaste
package. To conduct a further study, a random sample of 300 households would be collected. Let p
denote the sample proportion of 300 households that would prefer the new toothpaste package.
(A) Find the mean and standard deviation of the sampling distribution of p. Describe the shape of
the sampling distribution.
(B) What is the probability that the sample proportion would be between 0.4 and 1.0?
(C) What is the probability that less than 135 out of 300 households would prefer the new toothpaste
package?
(D) How would the mean and standard deviation of the sampling distribution change respectively if
a random sample of 500 households would be selected instead?
Expert Solution
This question has been solved!
Explore an expertly crafted, step-by-step solution for a thorough understanding of key concepts.
This is a popular solution
Trending nowThis is a popular solution!
Step by stepSolved in 5 steps with 3 images

Knowledge Booster
Similar questions
- A huge suspended LED screen is the centerpiece of The Place, a popular mall in Beijing, China. Find the length and width of a similar rectangular screen if the length is 5 meters more than 5 times its width, and the viewable area is 4,650 square meters. length = ? m width = ? marrow_forwardA cell phone company charges $50 for unlimited calls and $0.25 per text message. Another cell phone company charges $0.15 per text message and$70 for unlimited calls. How many text messages would have to be sent for the plans to cost the same amount?arrow_forwardA doctor receives two invoices for an order including gloves and masks. The first order cost $605 and included 2000 gloves and 500 masks while the second order of 10000 gloves and 600 masks cost $916 dollars. The invoice does not show the cost of the gloves or masks. Find the cost of each glove and of each mask.arrow_forward
- A taxicab company charges $4 for a trip up to 1 mile, and $2 for every extra mile ( or portion of a mile). Find the cost to ride 11 1/2 miles.arrow_forwardFabio paid $15.50 for five slices of pizza and two sodas . Liam paid $19.50 for six slices and three sodas. How much does a slice of pizza cost?arrow_forwardFor exercise, Mae jogs 2 miles then walks an additional 4 miles. If her jogging speed is 4.5 miles per hour faster than her walking speed and her total exercise time is 3 hours, what is her walking speed?arrow_forward
arrow_back_ios
arrow_forward_ios
Recommended textbooks for you
 MATLAB: An Introduction with ApplicationsStatisticsISBN:9781119256830Author:Amos GilatPublisher:John Wiley & Sons Inc
 Probability and Statistics for Engineering and th...StatisticsISBN:9781305251809Author:Jay L. DevorePublisher:Cengage Learning
 Statistics for The Behavioral Sciences (MindTap C...StatisticsISBN:9781305504912Author:Frederick J Gravetter, Larry B. WallnauPublisher:Cengage Learning
 Elementary Statistics: Picturing the World (7th E...StatisticsISBN:9780134683416Author:Ron Larson, Betsy FarberPublisher:PEARSON
 The Basic Practice of StatisticsStatisticsISBN:9781319042578Author:David S. Moore, William I. Notz, Michael A. FlignerPublisher:W. H. Freeman
 Introduction to the Practice of StatisticsStatisticsISBN:9781319013387Author:David S. Moore, George P. McCabe, Bruce A. CraigPublisher:W. H. Freeman

MATLAB: An Introduction with Applications
Statistics
ISBN:9781119256830
Author:Amos Gilat
Publisher:John Wiley & Sons Inc

Probability and Statistics for Engineering and th...
Statistics
ISBN:9781305251809
Author:Jay L. Devore
Publisher:Cengage Learning

Statistics for The Behavioral Sciences (MindTap C...
Statistics
ISBN:9781305504912
Author:Frederick J Gravetter, Larry B. Wallnau
Publisher:Cengage Learning

Elementary Statistics: Picturing the World (7th E...
Statistics
ISBN:9780134683416
Author:Ron Larson, Betsy Farber
Publisher:PEARSON

The Basic Practice of Statistics
Statistics
ISBN:9781319042578
Author:David S. Moore, William I. Notz, Michael A. Fligner
Publisher:W. H. Freeman

Introduction to the Practice of Statistics
Statistics
ISBN:9781319013387
Author:David S. Moore, George P. McCabe, Bruce A. Craig
Publisher:W. H. Freeman