MATLAB: An Introduction with Applications
6th Edition
ISBN: 9781119256830
Author: Amos Gilat
Publisher: John Wiley & Sons Inc
expand_more
expand_more
format_list_bulleted
Question

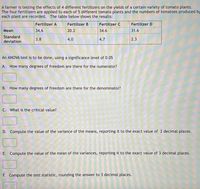
Transcribed Image Text:A farmer is testing the effects of 4 different fertilizers on the yields of a certain variety of tomato plants.
The four fertilizers are applied to each of 5 different tomato plants and the numbers of tomatoes produced by
each plant are recorded. The table below shows the results:
Fertilizer A
Fertilizer B
Fertilizer C
Fertilizer D
Mean
34.6
20.2
34.6
31.6
Standard
3.8
4.0
4.7
2.3
deviation
An ANOVA test is to be done, using a significance level of 0.05
A. How many degrees of freedom are there for the numerator?
B. How many degrees of freedom are there for the denominator?
C. What is the critical value?
D. Compute the value of the variance of the means, reporting it to the exact value of 2 decimal places.
E. Compute the value of the mean of the variances, reporting it to the exact value of 3 decimal places.
F. Compute the test statistic, rounding the answer to 3 decimal places.

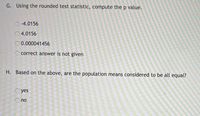
Transcribed Image Text:G. Using the rounded test statistic, compute the p value.
O-4.0156
O4.0156
0.000041456
O correct answer is not given
H. Based on the above, are the population means considered to be all equal?
O yes
no
Expert Solution
This question has been solved!
Explore an expertly crafted, step-by-step solution for a thorough understanding of key concepts.
This is a popular solution
Trending nowThis is a popular solution!
Step by stepSolved in 4 steps with 4 images

Knowledge Booster
Similar questions
- To investigate how people communicate over the internet, a researcher had subjects write messages in an online forum. She split her sample of 76 participants into young adults and older adults based on their age. She then compared how many emojis and emoticons the young adults used in their messages compared to the older adults. What is the best test to analyze the results of this study? One Sampe Z Test One Sample t Test Independent Samples t Test Dependent Samples t Testarrow_forwardSuppose you were to collect data for the following pair of variables, ski diving: depth, visibility. You want to make a scatterplot. Which variable would you use as the explanatory variable? depth visibility Which variable would you use as the response variable? O depth O visibility Would you expect to see a positive or negative association? positive negative O neitherarrow_forwardThe director of library services at a college did a survey of types of books (by subject) in the circulation library. Then she used library records to take a random sample of 888 books checked out last term and classified the books in the sample by subject. The results are shown below. Subject Area Percent of Books on Subject in CirculationLibrary on This Subject Number of Books inSample on This Subject Business 32% 247 Humanities 25% 209 Natural Science 20% 222 Social Science 15% 127 All other subjects 8% 83 Using a 5% level of significance, test the claim that the subject distribution of books in the library fits the distribution of books checked out by students. (a) What is the level of significance?State the null and alternate hypotheses. H0: The distributions are the same.H1: The distributions are different.H0: The distributions are different.H1: The distributions are different. H0: The distributions are the same.H1: The distributions are the same.H0: The…arrow_forward
- Virginia polled a large sample of individuals to find the percentage of students with known food allergies and the percentage of students without known food allergies. Which of the following could sufficiently display the data if only the two given categories are to be included? Select the correct answer below: bar graph pie chart either a pie chart or a bar graph neither a pie chart nor a bar grapharrow_forwardK A university conducted a survey of 387 undergraduate students regarding satisfaction with student government. Results of the survey are shown in the table by class rank. Complete parts (a) through (d) below. Click the icon to view the table. 美 Data table Satisfied Neutral Not satisfied Total Freshman Sophomore Junior Senior 51 48 62 59 28 20 18 13 23 21 18 26 102 89 98 98 Total D₁ 220 79 88 387arrow_forwardA survey was conducted on how many texts (in average) students receive during an in-person class time. A survey data in a class in a particular day is given in the table. Number students Number of texts 1 20 2 14 12 4 5 If the average number texts that students received during this class time is 3, then determine the number of students (the value of x) that received 5 texts during the class time on that particular day.arrow_forward
- The director of library services at a college did a survey of types of books (by subject) in the circulation library. Then she used library records to take a random sample of 888 books checked out last term and classified the books in the sample by subject. The results are shown below. Subject Area Percent of Books on Subject in CirculationLibrary on This Subject Number of Books inSample on This Subject Business 32% 284 Humanities 25% 218 Natural Science 20% 207 Social Science 15% 102 All other subjects 8% 77 (b) Find the value of the chi-square statistic for the sample. (Round the expected frequencies to three decimal places. Round the test statistic to three decimal places.)arrow_forwardThe director of library services at a college did a survey of types of books (by subject) in the circulation library. Then she used library records to take a random sample of 888 books checked out last term and classified the books in the sample by subject. The results are shown below. Subject Area Percent of Books on Subject in CirculationLibrary on This Subject Number of Books inSample on This Subject Business 32% 237 Humanities 25% 220 Natural Science 20% 223 Social Science 15% 128 All other subjects 8% 80 Using a 5% level of significance, test the claim that the subject distribution of books in the library fits the distribution of books checked out by students. (a) What is the level of significance?State the null and alternate hypotheses. H0: The distributions are the same.H1: The distributions are different.H0: The distributions are the same.H1: The distributions are the same. H0: The distributions are different.H1: The distributions are different.H0: The…arrow_forwardThe director of library services at a college did a survey of types of books (by subject) in the circulation library. Then she used library records to take a random sample of 888 books checked out last term and classified the books in the sample by subject. The results are shown below. Subject Area Percent of Books on Subject in CirculationLibrary on This Subject Number of Books inSample on This Subject Business 32% 267 Humanities 25% 217 Natural Science 20% 222 Social Science 15% 109 All other subjects 8% 73 Using a 5% level of significance, test the claim that the subject distribution of books in the library fits the distribution of books checked out by students. (a) What is the level of significance?State the null and alternate hypotheses. H0: The distributions are different.H1: The distributions are the same.H0: The distributions are the same.H1: The distributions are different. H0: The distributions are the same.H1: The distributions are the same.H0: The…arrow_forward
- A student researcher wants to test the hypothesis that an individual’s sex and education levels affect one’s political views. They examine males and females among three different education levels: high school, undergraduate, and graduate. Analysis: Ho:arrow_forwardThe director of library services at a college did a survey of types of books (by subject) in the circulation library. Then she used library records to take a random sample of 888 books checked out last term and classified the books in the sample by subject. The results are shown below. Subject Area Percent of Books on Subject in CirculationLibrary on This Subject Number of Books inSample on This Subject Business 32% 259 Humanities 25% 223 Natural Science 20% 213 Social Science 15% 126 All other subjects 8% 67 Using a 5% level of significance, test the claim that the subject distribution of books in the library fits the distribution of books checked out by students. (a) What is the level of significance?State the null and alternate hypotheses. H0: The distributions are different.H1: The distributions are the same.H0: The distributions are the same.H1: The distributions are the same. H0: The distributions are different.H1: The distributions are different.H0: The…arrow_forward
arrow_back_ios
arrow_forward_ios
Recommended textbooks for you
 MATLAB: An Introduction with ApplicationsStatisticsISBN:9781119256830Author:Amos GilatPublisher:John Wiley & Sons Inc
 Probability and Statistics for Engineering and th...StatisticsISBN:9781305251809Author:Jay L. DevorePublisher:Cengage Learning
 Statistics for The Behavioral Sciences (MindTap C...StatisticsISBN:9781305504912Author:Frederick J Gravetter, Larry B. WallnauPublisher:Cengage Learning
 Elementary Statistics: Picturing the World (7th E...StatisticsISBN:9780134683416Author:Ron Larson, Betsy FarberPublisher:PEARSON
 The Basic Practice of StatisticsStatisticsISBN:9781319042578Author:David S. Moore, William I. Notz, Michael A. FlignerPublisher:W. H. Freeman
 Introduction to the Practice of StatisticsStatisticsISBN:9781319013387Author:David S. Moore, George P. McCabe, Bruce A. CraigPublisher:W. H. Freeman

MATLAB: An Introduction with Applications
Statistics
ISBN:9781119256830
Author:Amos Gilat
Publisher:John Wiley & Sons Inc

Probability and Statistics for Engineering and th...
Statistics
ISBN:9781305251809
Author:Jay L. Devore
Publisher:Cengage Learning

Statistics for The Behavioral Sciences (MindTap C...
Statistics
ISBN:9781305504912
Author:Frederick J Gravetter, Larry B. Wallnau
Publisher:Cengage Learning

Elementary Statistics: Picturing the World (7th E...
Statistics
ISBN:9780134683416
Author:Ron Larson, Betsy Farber
Publisher:PEARSON

The Basic Practice of Statistics
Statistics
ISBN:9781319042578
Author:David S. Moore, William I. Notz, Michael A. Fligner
Publisher:W. H. Freeman

Introduction to the Practice of Statistics
Statistics
ISBN:9781319013387
Author:David S. Moore, George P. McCabe, Bruce A. Craig
Publisher:W. H. Freeman