
MATLAB: An Introduction with Applications
6th Edition
ISBN: 9781119256830
Author: Amos Gilat
Publisher: John Wiley & Sons Inc
expand_more
expand_more
format_list_bulleted
Related questions
Question
7
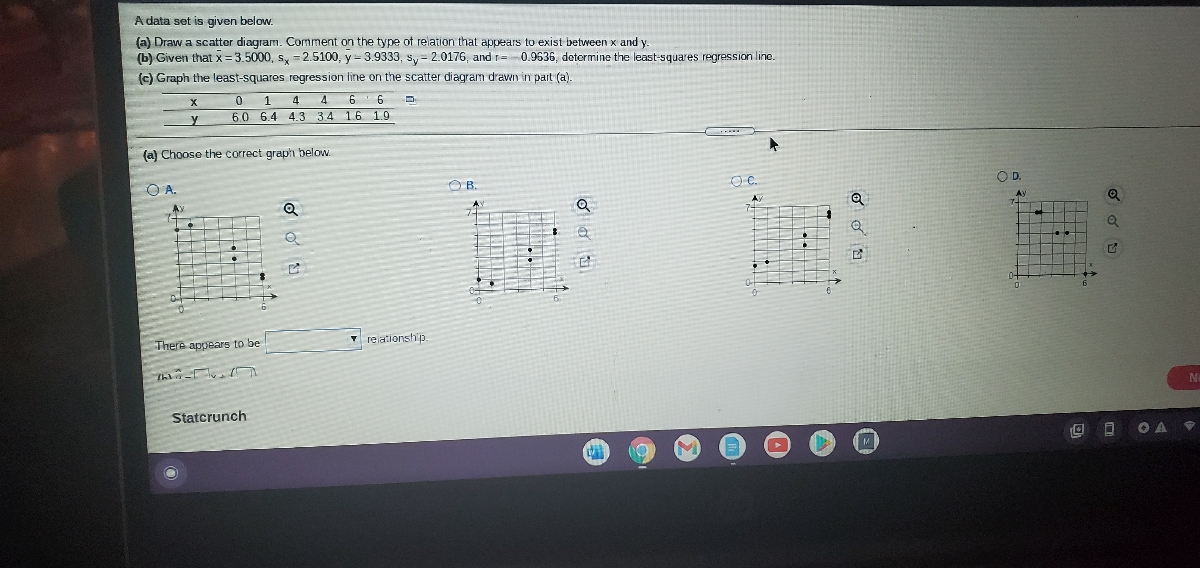

Transcribed Image Text:A data set is given below.
(a) Draw a scatter diagram. Comment on the type of relation that appears to exist between x and y.
(b) Given that x= 3.5000, s, =2.5100, y = 3.9333, s,= 2.0176, and r=0.9636, determine the least-squares regression line.
(c) Graph the least-squares regression line on the scatter diagram drawn in part (a).
4
6 6
6.0 6.4 4.3 3.4 1.6 1.9
4
(a) Choose the correct graph below.
O A
.
OB.
OC.
OD.
AY
Ay
There appears to be
v
rejationship.
Thi
No
Statcrunch
O O OA

Transcribed Image Text:A data set Is given below.
(a) Draw a scatter diagram. Comment on the type of relation that appears to exist between x and y
(b) Given that x = 3.5000, s, =2.5100, y = 3.9333, s, = 2.0176, and r= 0.9636, determine the least-squares regression line.
(c) Graph the least-squares regression line on the scatter diagram drawn in part (a)
1
4
6
6
y
6.0 6.4 4.3 3.4 1.6 1.9
(b) y =x+ ()
(Round to three decimal places as needed.)
(c) Choose the correct graph below.
O B.
OD.
7
Staterunch
Expert Solution
This question has been solved!
Explore an expertly crafted, step-by-step solution for a thorough understanding of key concepts.

This is a popular solution

Trending nowThis is a popular solution!

Step by stepSolved in 2 steps with 2 images

Knowledge Booster

Similar questions
Recommended textbooks for you
- MATLAB: An Introduction with ApplicationsStatisticsISBN:9781119256830Author:Amos GilatPublisher:John Wiley & Sons Inc
 Probability and Statistics for Engineering and th...StatisticsISBN:9781305251809Author:Jay L. DevorePublisher:Cengage Learning
 Statistics for The Behavioral Sciences (MindTap C...StatisticsISBN:9781305504912Author:Frederick J Gravetter, Larry B. WallnauPublisher:Cengage Learning
  Elementary Statistics: Picturing the World (7th E...StatisticsISBN:9780134683416Author:Ron Larson, Betsy FarberPublisher:PEARSON
 The Basic Practice of StatisticsStatisticsISBN:9781319042578Author:David S. Moore, William I. Notz, Michael A. FlignerPublisher:W. H. Freeman
 Introduction to the Practice of StatisticsStatisticsISBN:9781319013387Author:David S. Moore, George P. McCabe, Bruce A. CraigPublisher:W. H. Freeman
MATLAB: An Introduction with Applications
Statistics
ISBN:9781119256830
Author:Amos Gilat
Publisher:John Wiley & Sons Inc
Probability and Statistics for Engineering and th...
Statistics
ISBN:9781305251809
Author:Jay L. Devore
Publisher:Cengage Learning
Statistics for The Behavioral Sciences (MindTap C...
Statistics
ISBN:9781305504912
Author:Frederick J Gravetter, Larry B. Wallnau
Publisher:Cengage Learning
Elementary Statistics: Picturing the World (7th E...
Statistics
ISBN:9780134683416
Author:Ron Larson, Betsy Farber
Publisher:PEARSON
The Basic Practice of Statistics
Statistics
ISBN:9781319042578
Author:David S. Moore, William I. Notz, Michael A. Fligner
Publisher:W. H. Freeman
Introduction to the Practice of Statistics
Statistics
ISBN:9781319013387
Author:David S. Moore, George P. McCabe, Bruce A. Craig
Publisher:W. H. Freeman