
MATLAB: An Introduction with Applications
6th Edition
ISBN: 9781119256830
Author: Amos Gilat
Publisher: John Wiley & Sons Inc
expand_more
expand_more
format_list_bulleted
Related questions
Question
(a) Does the Normal
(b) Report the sample
(c) Construct a 99% confidence interval for the average mercury concentration from this lake after the smelter accident.
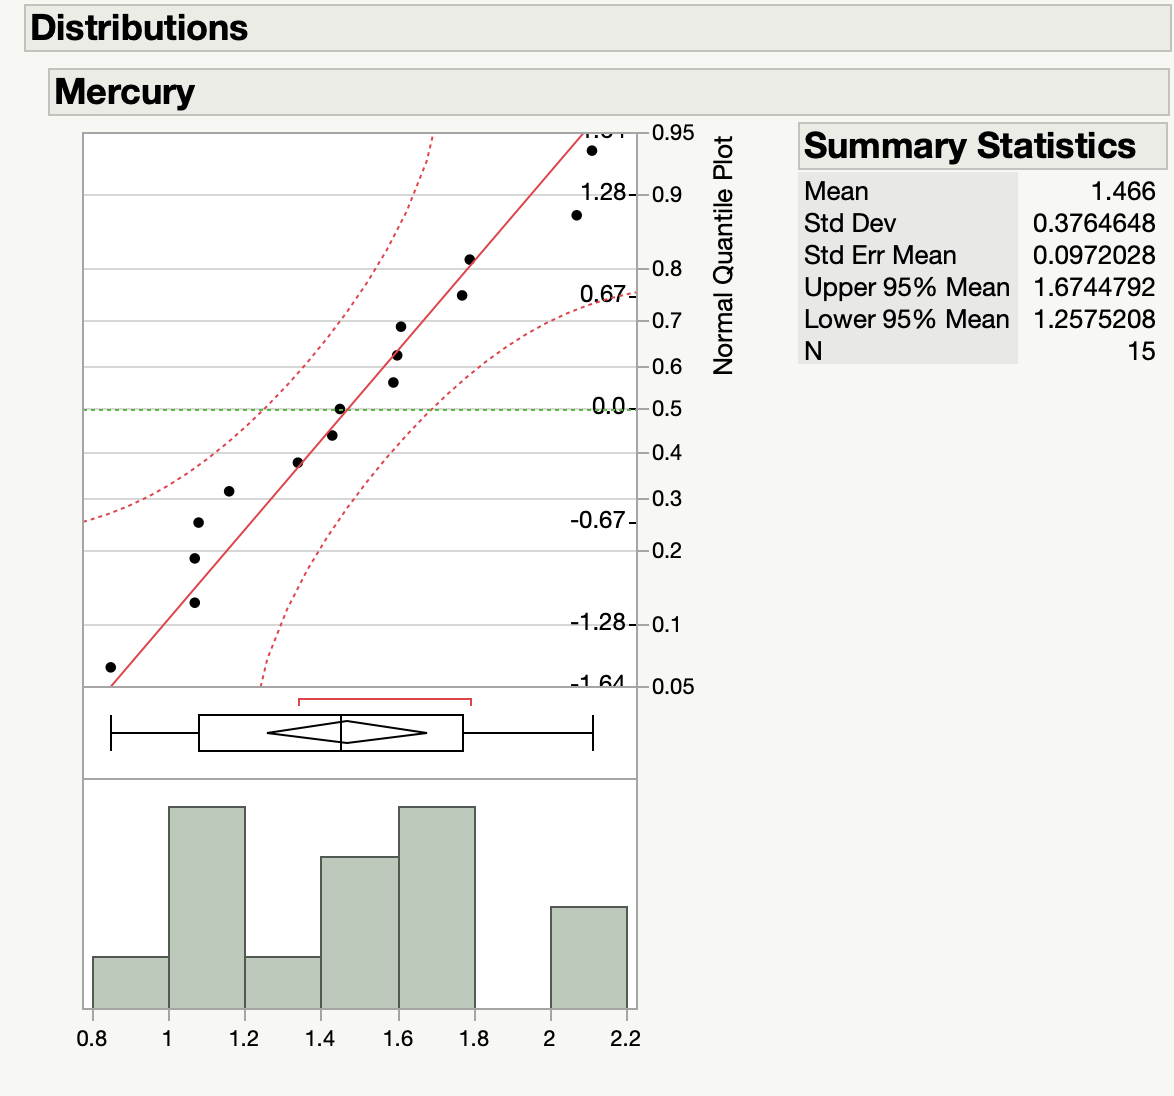

Transcribed Image Text:Distributions
Mercury
0.95
Summary Statistics
1.28-0.9
Мean
1.466
Std Dev
0.3764648
Std Err Mean
0.0972028
-0.8
0.67-
-0.7
Upper 95% Mean 1.6744792
Lower 95% Mean 1.2575208
15
0.6
-0.0--0.5
0.4
0.3
-0.67-
-0.2
-1.28- 0.1
-1.64.
-0.05
0.8
1
1.2
1.4
1.6
1.8
2
2.2
Normal Quantile Plot
Expert Solution
This question has been solved!
Explore an expertly crafted, step-by-step solution for a thorough understanding of key concepts.

This is a popular solution

Trending nowThis is a popular solution!

Step by stepSolved in 5 steps with 17 images

Knowledge Booster

Similar questions
- From generation to generation, the mean age when smokers first start to smoke varies. However, the standard deviation of that age remains constant at around 2.1 years. A survey of 41 smokers of this generation was done to see if the mean starting age is at least 19. The sample mean was 18.2 with a sample standard deviation of 1.3. Do the data support the claim at the 5% level? Note: If you are using a Student's t-distribution for the problem, you may assume that the underlying population is normally distributed. (In general, you must first prove that assumption, though.) Part 1) Sketch a picture of this situation. Label and scale the horizontal axis and shade the region(s) corresponding to the p-value Part 2) Alpha (Enter an exact number as an integer, fraction, or decimal.)α = Part 3) Construct a 95% confidence interval for the true mean. Sketch the graph of the situation. Label the point estimate and the lower and upper bounds of the confidence interval. (Round your lower and upper…arrow_forwardThe weights of a certain type of steer follow a Normal model with a mean weight of 1191 pounds and a standard deviation of 54 pounds. (Use 4 decimals for all answers below.)(a) What weight is required for a steer to be among the heaviest 10% of steers? (b) What weight is required for a steer to be among the lightest 25% of steers? (c) What is the IQR of these weights?arrow_forwardStatistically Graph appropriately with each problem.arrow_forward
- From generation to generation, the mean age when smokers first start to smoke varies. However, the standard deviation of that age remains constant at around 2.1 years. A survey of 42 smokers of this generation was done to see if the mean starting age is at least 19. The sample mean was 18.1 with a sample standard deviation of 1.3. Do the data support the claim at the 5% level?Note: If you are using a Student's t-distribution for the problem, you may assume that the underlying population is normally distributed. (In general, you must first prove that assumption, though.) State the distribution to use for the test. (Round your answers to four decimal places.) X ~ , What is the test statistic? (If using the z distribution round your answers to two decimal places, and if using the t distribution round your answers to three decimal places.) = What is the p-value? (Round your answer to four decimal places.)arrow_forwardHow do you find (b.)?arrow_forwardYou want to obtain a sample to estimate a population mean age. Based on previous evidence, you believe the population standard deviation is approximately o = 2.3 years. You would like to be 95% confident that your estimate is within 0.75 years of the true population mean. What is the smallest sample size you can use? The smallest possible sample has members.arrow_forward
- A newspaper article reported that 320 people in one state were surveyed and 80% were opposed to a recent court decision. The same article reported that a similar survey of 510 people in another state indicated opposition by only 30%. Construct a 99% confidence interval of the difference in population proportions based on the data. The 99% confidence interval of the difference in population proportions is ( (Round to four decimal places as needed.)arrow_forwardI attached.arrow_forwardplease help me with thisarrow_forward
arrow_back_ios
arrow_forward_ios
Recommended textbooks for you
- MATLAB: An Introduction with ApplicationsStatisticsISBN:9781119256830Author:Amos GilatPublisher:John Wiley & Sons Inc
 Probability and Statistics for Engineering and th...StatisticsISBN:9781305251809Author:Jay L. DevorePublisher:Cengage Learning
 Statistics for The Behavioral Sciences (MindTap C...StatisticsISBN:9781305504912Author:Frederick J Gravetter, Larry B. WallnauPublisher:Cengage Learning
  Elementary Statistics: Picturing the World (7th E...StatisticsISBN:9780134683416Author:Ron Larson, Betsy FarberPublisher:PEARSON
 The Basic Practice of StatisticsStatisticsISBN:9781319042578Author:David S. Moore, William I. Notz, Michael A. FlignerPublisher:W. H. Freeman
 Introduction to the Practice of StatisticsStatisticsISBN:9781319013387Author:David S. Moore, George P. McCabe, Bruce A. CraigPublisher:W. H. Freeman
MATLAB: An Introduction with Applications
Statistics
ISBN:9781119256830
Author:Amos Gilat
Publisher:John Wiley & Sons Inc
Probability and Statistics for Engineering and th...
Statistics
ISBN:9781305251809
Author:Jay L. Devore
Publisher:Cengage Learning
Statistics for The Behavioral Sciences (MindTap C...
Statistics
ISBN:9781305504912
Author:Frederick J Gravetter, Larry B. Wallnau
Publisher:Cengage Learning
Elementary Statistics: Picturing the World (7th E...
Statistics
ISBN:9780134683416
Author:Ron Larson, Betsy Farber
Publisher:PEARSON
The Basic Practice of Statistics
Statistics
ISBN:9781319042578
Author:David S. Moore, William I. Notz, Michael A. Fligner
Publisher:W. H. Freeman
Introduction to the Practice of Statistics
Statistics
ISBN:9781319013387
Author:David S. Moore, George P. McCabe, Bruce A. Craig
Publisher:W. H. Freeman