MATLAB: An Introduction with Applications
6th Edition
ISBN: 9781119256830
Author: Amos Gilat
Publisher: John Wiley & Sons Inc
expand_more
expand_more
format_list_bulleted
Question
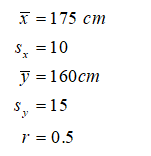
A doctor records height and weight for her patients. The correlation between height and weight is 0.5. The average height is 175cm with SD=10. The average weight is 160 pounds with SD=15. Suppose a person's height is 170cm, what is the predicted weight? Choose the answer below that is closest.
Group of answer choices
150
156
170
140
Expert Solution
arrow_forward
Step 1
Given that,

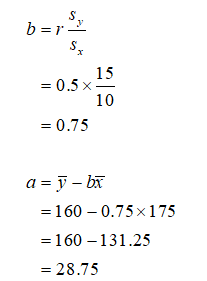
The slope and intercept values are,

Trending nowThis is a popular solution!
Step by stepSolved in 2 steps with 4 images

Knowledge Booster
Similar questions
- Use a stem-and-leaf plot to display the data, which represent the numbers of hours 24 nurses work per week. Describe any patterns. 40 42 48 32 40 30 23 40 36 40 Key: 313=33 Hours worked 2 3 4 5 Determine the leaves in the stem-and-leaf plot below. 50 32 36 40 35 38 49 What best describes the data? 40 36 36 40 33 40 32 OA. Most nurses work over 40 hours per week. OB. Most nurses work under 40 hours per week. OC. Most nurses work between 40 and 50 hours per week, inclusive. OD. Most nurses work between 30 and 40 hours per week, inclusive.arrow_forwardIn a married couple, the husband and wife are both 5 feet, 4 inches (64 inches) tall. Which person has a higher z-score, with respect to their gender? Group of answer choices The husband We can not tell with the information given. They are the same. The wifearrow_forwardA study is planned to compare the proportion of teenagers (ages 13–19) who dislike anchovies with the proportion of young adults (ages 20–30) who dislike anchovies. A random sample of 41 teenagers was taken, and 78% of them disliked anchovies. A random sample of 56 young adults was also taken, and 71% of them disliked anchovies. Difference = Teenagers - Young Adults The picture below is the question. Use the information above to help.arrow_forward
- Do A/Barrow_forwardThe prices vary depending on the condition of the radio. $210, $210, $320, $200, $300, $10, $340, $300, $245, $325, $700, $250, $240, $200 a. Find the mean of the radio prices. Round to the nearest cent.arrow_forwardmake a stem and leaf plot for 6,7,8,14,14,16,21,26,30,30 - whats the median and mean? - how does the median and mean change if the numbers are 6,7,8,14,14,16,21,26,30,130. Needs Complete solution with 100 % accuracy.arrow_forward
- The ages (in years) and helghts (in inches) of all pitchers for a beseball team are listed. Find the coefficient of variation for each of the two data sets. Then compare the results. -Click the Icon to view the data sets. CV. %D Round to one decimal place as needed.)arrow_forwardplease help what did i do wrong?arrow_forwardTo take a medical test and the doctor tells you that your wellness z-score is 1.86. What percent of the population is in worse health? a. -0.031 b. -0.969 c. 0.969 d. 0.031arrow_forward
- Scores on a test have a mean of 66 and a standard diviation of 9. Michelle has a score of 57. Convert Michelles score to z-score.arrow_forwardThe Acme Company manufactures widgets. The distribution of widget weights is bell-shaped. The widget weights have a mean of 40 ounces and a standard deviation of 10 ounces. Use the Standard Deviation Rule, also known as the Empirical Rule. Suggestion: sketch the distribution in order to answer these questions. a) 99.7% of the widget weights lie between and b) What percentage of the widget weights lie between 20 and 70 ounces? c) What percentage of the widget weights lie above 30 ? Question Help: Video Message instructor %arrow_forwardWhich equation represents the data in the table? 3. 4 100 25 6.25 1.5625 O A " y = 100() O B. y= 400(금)" %3D O Cy =(100)" O D. y =(400)"arrow_forward
arrow_back_ios
SEE MORE QUESTIONS
arrow_forward_ios
Recommended textbooks for you
 MATLAB: An Introduction with ApplicationsStatisticsISBN:9781119256830Author:Amos GilatPublisher:John Wiley & Sons Inc
 Probability and Statistics for Engineering and th...StatisticsISBN:9781305251809Author:Jay L. DevorePublisher:Cengage Learning
 Statistics for The Behavioral Sciences (MindTap C...StatisticsISBN:9781305504912Author:Frederick J Gravetter, Larry B. WallnauPublisher:Cengage Learning
 Elementary Statistics: Picturing the World (7th E...StatisticsISBN:9780134683416Author:Ron Larson, Betsy FarberPublisher:PEARSON
 The Basic Practice of StatisticsStatisticsISBN:9781319042578Author:David S. Moore, William I. Notz, Michael A. FlignerPublisher:W. H. Freeman
 Introduction to the Practice of StatisticsStatisticsISBN:9781319013387Author:David S. Moore, George P. McCabe, Bruce A. CraigPublisher:W. H. Freeman

MATLAB: An Introduction with Applications
Statistics
ISBN:9781119256830
Author:Amos Gilat
Publisher:John Wiley & Sons Inc

Probability and Statistics for Engineering and th...
Statistics
ISBN:9781305251809
Author:Jay L. Devore
Publisher:Cengage Learning

Statistics for The Behavioral Sciences (MindTap C...
Statistics
ISBN:9781305504912
Author:Frederick J Gravetter, Larry B. Wallnau
Publisher:Cengage Learning

Elementary Statistics: Picturing the World (7th E...
Statistics
ISBN:9780134683416
Author:Ron Larson, Betsy Farber
Publisher:PEARSON

The Basic Practice of Statistics
Statistics
ISBN:9781319042578
Author:David S. Moore, William I. Notz, Michael A. Fligner
Publisher:W. H. Freeman

Introduction to the Practice of Statistics
Statistics
ISBN:9781319013387
Author:David S. Moore, George P. McCabe, Bruce A. Craig
Publisher:W. H. Freeman