
MATLAB: An Introduction with Applications
6th Edition
ISBN: 9781119256830
Author: Amos Gilat
Publisher: John Wiley & Sons Inc
expand_more
expand_more
format_list_bulleted
Related questions
Question
I need help in what I did wrong with this question
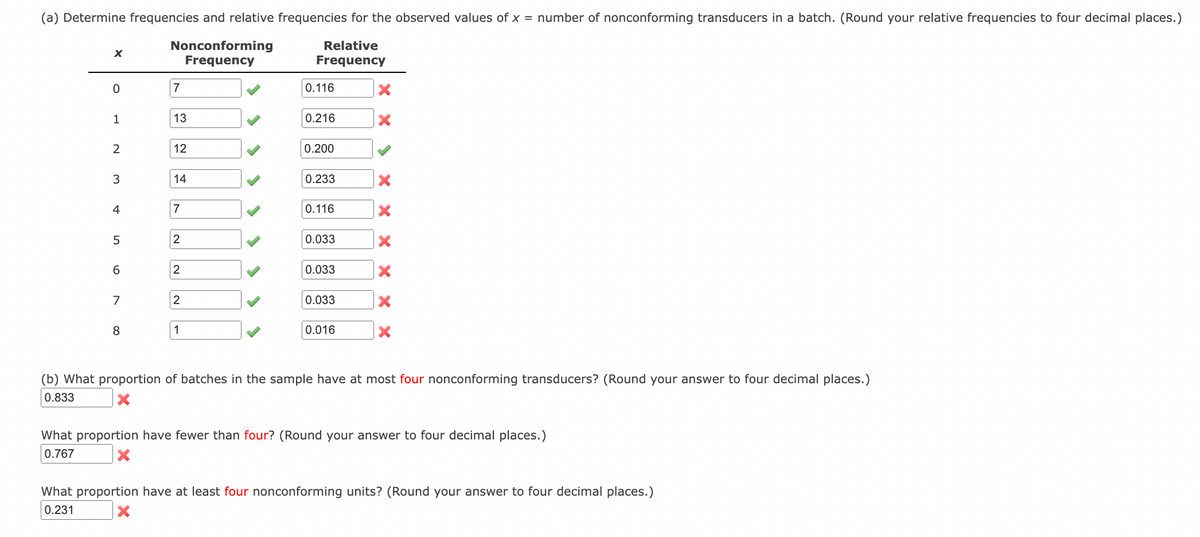

Transcribed Image Text:(a) Determine frequencies and relative frequencies for the observed values of x = number of nonconforming transducers in a batch. (Round your relative frequencies to four decimal places.)
Nonconforming
Frequency
Relative
Frequency
7
0.116
1
13
0.216
12
0.200
3
14
0.233
4
7
0.116
5
2
0.033
6.
2
0.033
7
2
0.033
8
1
0.016
(b) What proportion of batches in the sample have at most four nonconforming transducers? (Round your answer to four decimal places.)
0.833
What proportion have fewer than four? (Round your answer to four decimal places.)
0.767
What proportion have at least four nonconforming units? (Round your answer to four decimal places.)
0.231
Expert Solution
arrow_forward
Step 1


Trending nowThis is a popular solution!

Step by stepSolved in 3 steps with 3 images

Knowledge Booster

Similar questions
- What are the two types of incorrect decisions?arrow_forwardA marketing firm wishes to test the effectiveness of the audio/visual presentation of certain information as opposed to the purely audio presentation of the information. To this end 100 volunteers were given a 10 minute presentation in which the information was presented in an audio/visual format. A second group of 100 volunteers was presented the same information in a purely audio format. Each person in each of the two groups was asked the same 20 questions related to the information in the presentation. The audio/visual group had an average of 10.5 correct responses with a sample standard deviation of 4. The purely audio group had an average of 9.4 correct responses with a standard deviation of 3. The marketing firm believes this means that the audio/visual format leads to better retention of the information. We test the hypotheses H0: 1 -2=0 versus Ha: 1 -2>0 at a 2% level of significance. Here denotes 1 the population average number of correct responses for…arrow_forwardIn 2004 it surfaced in Reader's Digest presented as having happened to a teacher at an unnamed community college. Four students walked in halfway through American history test my father was giving at the local community college. "Sorry," they said, "we had a flat tire." An understanding man, Dad said that if they could answer just one question correctly, he would give them each an "A" for the exam. The students agreed. So my father handed each one a piece of paper, placed them in four separate comers and said, "Write down which tire was flat." Kurt Smith What is the probability that these four students would give identical answers if they hadn't had a flat tire? Why?arrow_forward
- For this problem, assume the test had 6 true-false questions and 8 multiple-choice questions, and that each multiple-choice question had 5 choices. How many different answer sheets can be submitted?arrow_forwardi understand that it is option b but you did not tell me what goes in that box, there is a number ( ,y) that is there and you did not specify , could you please doarrow_forwardA marketing firm wishes to test the effectiveness of the audio/visual presentation of certain information as opposed to the purely audio presentation of the information. To this end 100 volunteers were given a 10 minute presentation in which the information was presented in an audio/visual format. A second group of 100 volunteers was presented the same information in a purely audio format. Each person in each of the two groups was asked the same 20 questions related to the information in the presentation. The audio/visual group had an average of 10.5 correct responses with a sample standard deviation of 4. The purely audio group had an average of 9.4 correct responses with a standard deviation of 3. The marketing firm believes this means that the audio/visual format leads to better retention of the information. We test the hypotheses H0: 1 -2=0 versus Ha: 1 -2>0 at a 2% level of significance. Here denotes 1 the population average number of correct responses for…arrow_forward
arrow_back_ios
arrow_forward_ios
Recommended textbooks for you
- MATLAB: An Introduction with ApplicationsStatisticsISBN:9781119256830Author:Amos GilatPublisher:John Wiley & Sons Inc
 Probability and Statistics for Engineering and th...StatisticsISBN:9781305251809Author:Jay L. DevorePublisher:Cengage Learning
 Statistics for The Behavioral Sciences (MindTap C...StatisticsISBN:9781305504912Author:Frederick J Gravetter, Larry B. WallnauPublisher:Cengage Learning
  Elementary Statistics: Picturing the World (7th E...StatisticsISBN:9780134683416Author:Ron Larson, Betsy FarberPublisher:PEARSON
 The Basic Practice of StatisticsStatisticsISBN:9781319042578Author:David S. Moore, William I. Notz, Michael A. FlignerPublisher:W. H. Freeman
 Introduction to the Practice of StatisticsStatisticsISBN:9781319013387Author:David S. Moore, George P. McCabe, Bruce A. CraigPublisher:W. H. Freeman
MATLAB: An Introduction with Applications
Statistics
ISBN:9781119256830
Author:Amos Gilat
Publisher:John Wiley & Sons Inc
Probability and Statistics for Engineering and th...
Statistics
ISBN:9781305251809
Author:Jay L. Devore
Publisher:Cengage Learning
Statistics for The Behavioral Sciences (MindTap C...
Statistics
ISBN:9781305504912
Author:Frederick J Gravetter, Larry B. Wallnau
Publisher:Cengage Learning
Elementary Statistics: Picturing the World (7th E...
Statistics
ISBN:9780134683416
Author:Ron Larson, Betsy Farber
Publisher:PEARSON
The Basic Practice of Statistics
Statistics
ISBN:9781319042578
Author:David S. Moore, William I. Notz, Michael A. Fligner
Publisher:W. H. Freeman
Introduction to the Practice of Statistics
Statistics
ISBN:9781319013387
Author:David S. Moore, George P. McCabe, Bruce A. Craig
Publisher:W. H. Freeman