
MATLAB: An Introduction with Applications
6th Edition
ISBN: 9781119256830
Author: Amos Gilat
Publisher: John Wiley & Sons Inc
expand_more
expand_more
format_list_bulleted
Related questions
Question

Transcribed Image Text:-
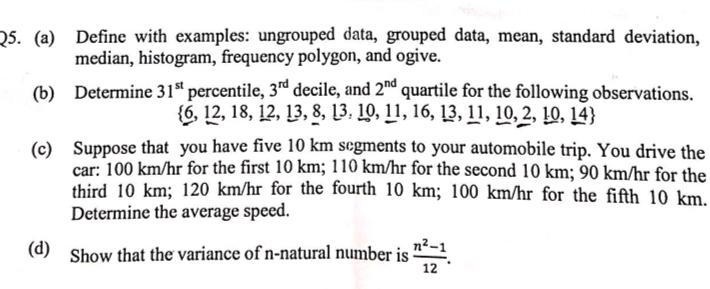
(a) Define with examples: ungrouped data, grouped data, mean, standard deviation,
median, histogram, frequency polygon, and ogive.
(b) Determine 31" percentile, 3rd decile, and 2d quartile for the following observations.
{6, 12, 18, 12, 13, 8, 13, 10, 11, 16, 13, 11, 10, 2, Ļ0, 14}
(c) Suppose that you have five 10 km segments to your automobile trip. You drive the
car: 100 km/hr for the first 10 km; 110 km/hr for the second 10 km; 90 km/hr for the
Expert Solution
This question has been solved!
Explore an expertly crafted, step-by-step solution for a thorough understanding of key concepts.

This is a popular solution

Trending nowThis is a popular solution!

Step by stepSolved in 2 steps with 5 images

Knowledge Booster


Learn more about
Need a deep-dive on the concept behind this application? Look no further. Learn more about this topic, statistics and related others by exploring similar questions and additional content below.Similar questions
- Question 3 The number of hours worked per week for a sample of ten students is shown below. Student Hours 1 39 28 10 16 26 34 38 9. 4 10 32 1. Determine the mean, median, and mode. 2. What is the range of the data for the hours worked? 3. What is the standard deviation for the number of hours worked? 2. 3. 4, 7, 8.arrow_forwardThe following are distances (in miles) traveled to the workplace by 18 employees of a certain hospital. 22 , 14 , 6 , 9 , 32 , 11 , 1 , 15 , 13 , 28 , 37 , 18 , 18 , 14 , 10 , 24 , 36 , 2 Send data to calculator Find 25th and 60th percentiles for these distances.(If necessary, consult a list of formulas.) (a) The 25th percentile: miles (b) The 60th percentile: milesarrow_forwardConsider the following data: −10, −10, 0, 3, −10, 3, 3 Step 1 of 3: Calculate the value of the sample Variance. Round your answer to one decimal place. Step 2 of 3: Calculate the value of the sample deviation. Round your answer to one decimal place. Step 3 of 3: Calculate the value of the range.arrow_forward
- when computing descriptive statistics, we are interested only both describing our data and also in presenting the means and standard deviations of all dependent variables. True or false When writing your participant section, you include all measures of central tendency (mean, median, mode) and all measures of variablility (variance, range, standard deviation). True or falsearrow_forward(b) Suppose that the measurement 37 (the largest measurement in the data set) were replaced by 69. Which measures of central tendency would be affected by the change? Choose all that apply. Mean Median Mode O None of these measuresarrow_forwardQuestion H The number of chocolate chips in a bag of chocolate chip cookies is approximately normally distributed with a mean of 1261 chips and a standard deviation of 118 chips. (a) Determine the 28th percentile for the number of chocolate chips in a bag. (b) Determine the number of chocolate chips in a bag that make up the middle 96% of bags. (c) What is the interquartile range of the number of chocolate chips in a bag of chocolate chip cookies? (a) The 28th percentile for the number of chocolate chips in a bag of chocolate chip cookies is (Round to the nearest whole number as needed.) chocolate chips. (b) The number of chocolate chips in a bag that make up the middle 96% of bags is | (Round to the nearest whole number as needed. Use ascending order.) chocolate chips. to (c) The interquartile range of the number of chocolate chips is (Round to the nearest whole number as needed.) Enter your answer in each of the answer boxes. 11:59pm thase Options A0.50LA Type here to searcharrow_forward
- What was the age distribution of prehistoric Native Americans? Extensive anthropological studies in the southwestern United States gave the following information about a prehistoric extended family group of 84 members on what is now a Native American reservation. For this community, estimate the mean age expressed in years, the sample variance, and the sample standard deviation. For the ciass 31 and over, use 35.5 as the class midpoint. (Round your answers to one decimal place.) Age range (years) Number of individuals 1-10 11-20 19 21-30 15 31 and over 40 10arrow_forwardThe histogram below shows the ages (in years) of Honda Civic automobiles listed for sale on the Seattle Times Web site on November 26, 2003. 20 15 10 2 4 6 8 10 12 14 16 18 Age (years) Which of the following terms apply to this histogram? (Select all that apply.) O negatively skewed(to the left) O uniform O symmetric O bimodal O unimodal O positively skewed(to the right) Which measure of center is most appropriate for this data? O median O mean Which measure of spread is most appropriate for this data? O standard deviation M # of carsarrow_forward
arrow_back_ios
arrow_forward_ios
Recommended textbooks for you
- MATLAB: An Introduction with ApplicationsStatisticsISBN:9781119256830Author:Amos GilatPublisher:John Wiley & Sons Inc
 Probability and Statistics for Engineering and th...StatisticsISBN:9781305251809Author:Jay L. DevorePublisher:Cengage Learning
 Statistics for The Behavioral Sciences (MindTap C...StatisticsISBN:9781305504912Author:Frederick J Gravetter, Larry B. WallnauPublisher:Cengage Learning
  Elementary Statistics: Picturing the World (7th E...StatisticsISBN:9780134683416Author:Ron Larson, Betsy FarberPublisher:PEARSON
 The Basic Practice of StatisticsStatisticsISBN:9781319042578Author:David S. Moore, William I. Notz, Michael A. FlignerPublisher:W. H. Freeman
 Introduction to the Practice of StatisticsStatisticsISBN:9781319013387Author:David S. Moore, George P. McCabe, Bruce A. CraigPublisher:W. H. Freeman
MATLAB: An Introduction with Applications
Statistics
ISBN:9781119256830
Author:Amos Gilat
Publisher:John Wiley & Sons Inc
Probability and Statistics for Engineering and th...
Statistics
ISBN:9781305251809
Author:Jay L. Devore
Publisher:Cengage Learning
Statistics for The Behavioral Sciences (MindTap C...
Statistics
ISBN:9781305504912
Author:Frederick J Gravetter, Larry B. Wallnau
Publisher:Cengage Learning
Elementary Statistics: Picturing the World (7th E...
Statistics
ISBN:9780134683416
Author:Ron Larson, Betsy Farber
Publisher:PEARSON
The Basic Practice of Statistics
Statistics
ISBN:9781319042578
Author:David S. Moore, William I. Notz, Michael A. Fligner
Publisher:W. H. Freeman
Introduction to the Practice of Statistics
Statistics
ISBN:9781319013387
Author:David S. Moore, George P. McCabe, Bruce A. Craig
Publisher:W. H. Freeman