
MATLAB: An Introduction with Applications
6th Edition
ISBN: 9781119256830
Author: Amos Gilat
Publisher: John Wiley & Sons Inc
expand_more
expand_more
format_list_bulleted
Related questions
Concept explainers
Question
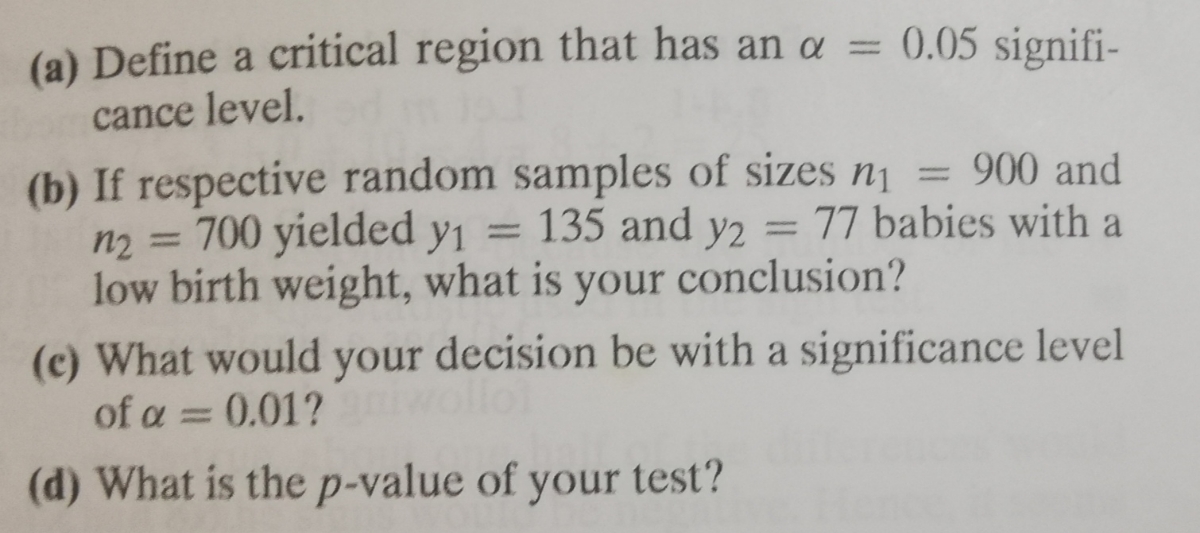

Transcribed Image Text:(a) Define a critical region that has an a = 0.05 signifi-
%3D
cance level.
(b) If respective random samples of sizes n = 900 and
n2 = 700 yielded y1 =
low birth weight, what is your conclusion?
135 and y2 = 77 babies with a
(c) What would your decision be with a significance level
of a = 0.01? iwollo
%3D
(d) What is the p-value of your test?

Transcribed Image Text:8.3-14. For developing countries in Africa and the
Americas, let pi and p2 be the respective proportions of
babies with a low birth weight (below 2500 grams). We
shall test Ho: P1 = P2 against the alternative hypothesis
H1: P1 > P2.
%3|
Expert Solution
This question has been solved!
Explore an expertly crafted, step-by-step solution for a thorough understanding of key concepts.

Step by stepSolved in 5 steps

Knowledge Booster


Learn more about
Need a deep-dive on the concept behind this application? Look no further. Learn more about this topic, statistics and related others by exploring similar questions and additional content below.Similar questions
- What would be the minimum sample size for an independent samples t-test with a small effect size where eta squared = .01, alpha = .05, and statistical power = .70?arrow_forwardesc You may need to use the appropriate technology to answer this question. Information regarding the ACT scores of samples of students in three different majors is given below. ! 81°F Partly sunny Sample Size f1 Average Sample Variance (a) Compute the overall sample mean . 29.5 X 1 ? Between Treatments Within Treatments @ Total Management (b) Set up the ANOVA table for this problem including the test statistic. (Round your mean squares to four decimal places and your F statistic to two decimal places.) 2 12 f3 26 # 17 * 3 Source of Variation Sum of Squares Degrees of Freedom (c) Using a = 0.01, determine the critical value of F. (Round your answer to two decimal places.) Major (d) Using the critical value approach, test to determine whether there is a significant difference in the means of the three populations. O We should not reject H. and therefore can conclude that there is a significant difference among the means of the three populations. We should not reject H. and therefore…arrow_forwardStudies show that the level of anxiety has changed since the pandemic. The average score before the pandemic was mu equal to 36. A sample of 20 individuals surveyed in the past two weeks produced M=37.6 and s=9.8. Based on the sample, was there a significant difference in the average anxiety level since the pandemic started at the 5% significance level? What is the positive critical value? (a)2.093 (b)2.086 (c)1.729 (d)1.725arrow_forward
- A sample of 51 stocks traded on the NYSE that day showed that 5 went up.You are conducting a study to see if the proportion of stocks that went up is is significantly less than 0.3. You use a significance level of α=0.02α=0.02.What is the test statistic for this sample? (Report answer accurate to three decimal places.)test statistic = What is the p-value for this sample? (Report answer accurate to four decimal places.)p-value =arrow_forwardYou are conducting a study to see if the accuracy rate for fingerprint identification is significantly more than 0.88. You use a significance level of α=0.001. H0:p=0.88 H1:p>0.88You obtain a sample of size n=208 in which there are 192 successes.What is the test statistic for this sample? (Report answer accurate to three decimal places.) test statistic = What is the p-value for this sample? (Report answer accurate to four decimal places.) p-value = The p-value is... _______ less than (or equal to) α (or) _______ greater than αarrow_forwardDetermine the critical value for a left tailed test of a population mean at the a= 0.01 level of significance based on a sample size of n= 9.arrow_forward
- (a) Does the sample provide evidence of a significant difference in popularity among the six actors, at a 5% significance level?Round your answer for the chi-square statistic to two decimal places, and your answer for the p-value to three decimal places. X^2 : p-value : (b) Repeat the test from part (a) if we ignore the results for George Lazenby, who only appeared in one Bond film. Do we find evidence of a significant difference in popularity among the remaining five actors? Round your answer for the chi-square statistic to two decimal places, and your answer for the p-value to three decimal places. X^2 : p-value :arrow_forwardFind the critical value(s) and rejection region(s) for a left-tailed chi-square test with a sample size n=22 and level of significance α=0.05. LOADING... Click the icon to view the Chi-Square Distribution Table. Find the critical value(s). enter your response here (Round to three decimal places as needed. Use a comma to separate answers as needed.) Find the Rejection Region(s).arrow_forwardA survey was conducted to investigate the relationship between gender (male and females) and sector of employment (private, government and academia). Using the information provided, does a relationship exist between gender and employment sector at the 5% significance level? If the Chi-square test statistics = 0.529, what conclusion can be made? A. Since Chi-square test statistics > Chi-square critical value, do not reject H0 B. Since Chi-square test statistics < Chi-square critical value, do not reject H0 C. Since Chi-square test statistics < Chi-square critical value, Reject H0 D. Since Chi-square test statistics > Chi-square critical value, Reject H0arrow_forward
arrow_back_ios
SEE MORE QUESTIONS
arrow_forward_ios
Recommended textbooks for you
- MATLAB: An Introduction with ApplicationsStatisticsISBN:9781119256830Author:Amos GilatPublisher:John Wiley & Sons Inc
 Probability and Statistics for Engineering and th...StatisticsISBN:9781305251809Author:Jay L. DevorePublisher:Cengage Learning
 Statistics for The Behavioral Sciences (MindTap C...StatisticsISBN:9781305504912Author:Frederick J Gravetter, Larry B. WallnauPublisher:Cengage Learning
  Elementary Statistics: Picturing the World (7th E...StatisticsISBN:9780134683416Author:Ron Larson, Betsy FarberPublisher:PEARSON
 The Basic Practice of StatisticsStatisticsISBN:9781319042578Author:David S. Moore, William I. Notz, Michael A. FlignerPublisher:W. H. Freeman
 Introduction to the Practice of StatisticsStatisticsISBN:9781319013387Author:David S. Moore, George P. McCabe, Bruce A. CraigPublisher:W. H. Freeman
MATLAB: An Introduction with Applications
Statistics
ISBN:9781119256830
Author:Amos Gilat
Publisher:John Wiley & Sons Inc
Probability and Statistics for Engineering and th...
Statistics
ISBN:9781305251809
Author:Jay L. Devore
Publisher:Cengage Learning
Statistics for The Behavioral Sciences (MindTap C...
Statistics
ISBN:9781305504912
Author:Frederick J Gravetter, Larry B. Wallnau
Publisher:Cengage Learning
Elementary Statistics: Picturing the World (7th E...
Statistics
ISBN:9780134683416
Author:Ron Larson, Betsy Farber
Publisher:PEARSON
The Basic Practice of Statistics
Statistics
ISBN:9781319042578
Author:David S. Moore, William I. Notz, Michael A. Fligner
Publisher:W. H. Freeman
Introduction to the Practice of Statistics
Statistics
ISBN:9781319013387
Author:David S. Moore, George P. McCabe, Bruce A. Craig
Publisher:W. H. Freeman