
MATLAB: An Introduction with Applications
6th Edition
ISBN: 9781119256830
Author: Amos Gilat
Publisher: John Wiley & Sons Inc
expand_more
expand_more
format_list_bulleted
Related questions
Question
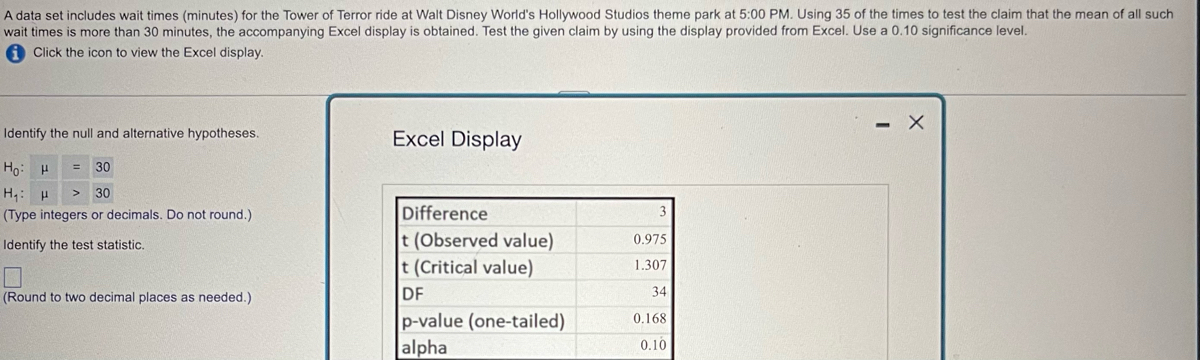

Transcribed Image Text:A data set includes wait times (minutes) for the Tower of Terror ride at Walt Disney World's Hollywood Studios theme park at 5:00 PM. Using 35 of the times to test the claim that the mean of all such
wait times is more than 30 minutes, the accompanying Excel display is obtained. Test the given claim by using the display provided from Excel. Use a 0.10 significance level.
Click the icon to view the Excel display.
Identify the null and alternative hypotheses.
Excel Display
30
Ho H
H₁ H >
30
(Type integers or decimals. Do not round.).
Identify the test statistic.
☐
(Round to two decimal places as needed.)
Difference
t (Observed value)
0.975
t (Critical value)
DF
1.307
34
p-value (one-tailed)
alpha
0.168
0.10
- X
Expert Solution
This question has been solved!
Explore an expertly crafted, step-by-step solution for a thorough understanding of key concepts.

Step by stepSolved in 2 steps with 1 images

Knowledge Booster

Similar questions
- A researcher gathered a sample of participants who volunteered for a studying of phobias. She measured anxiety level of participants as they viewed photos of spiders and again when they viewed puppies. Which statistical test is appropriate for this study and why?arrow_forwardThe accompanying data set lists performance IQ scores for random samples of subjects with blood lead levels categorized as low (1), medium (2), and high (3). Use a 0.05 significance level to test the claim that subjects in those categories have the same median performance IQ score (IQP). Does lead exposure appear to have an adverse effect? Click the icon to view the data for IQ and Lead Exposure First determine the null and alternative hypotheses. Choose the correct answer below. O A. Ho: The samples come from populations with medians that are not all equal. H₁: The samples come from populations with equal medians. O B. Ho: The samples come from populations with equal medians. H₁: The samples come from populations with medians that are not all equal. OC. Ho: The samples come from populations with equal means. H₁: The samples come from populations with means that are not all equal. O D. Ho: The samples come from populations with means that are not all equal. H₁: The samples come from…arrow_forwardA study was conducted to determine the proportion of people who dream in black and white instead of color. Among 300 people over the age of 55,80 dream in black and white, and among 287 people under the age of 25, 14 dreams in black and white. Use a 0.01 significance level to test the claim that the proportion of people over 55 who dream in black and white is greater than the proportion for those under 25. An explanation for the results is that those over the age of 55 grew up exposed to media that was displayed in black and white. Can these results be used to verify that explanation?arrow_forward
- Portland State University (PSU) reported that 64% of their students receive financial aid. A PSU administrator feels that their school may have a different proportion compared to all of Oregon schools. A random sample of 409 students in Oregon found that 259 receive financial aid. Test the claim that proportion of students that receive financial aid in Oregon is different than PSU. Use a 1% significance level. Give answer to at least 4 decimal places. a. What are the correct hypotheses? (Select the correct symbols and use decimal values not percentages.) Ho: Select an answer ?v H₁: Select an answer ? ✓ Based on the hypotheses, compute the following: b. Test Statistic = c. p-value = d. Based on the above we choose to Select an answer e. The correct summary would be: Select an answer that the proportion of students that receive financial aid in Oregon is different than the PSU reported value of 64%.arrow_forwardA study was conducted to determine the proportion of people who dream in black and white instead of color. Among 285 people over the age of 55, 68 dream in black and white, and among 307 people under the age of 25, 14 dream in black and white. Use a 0.01 significance level to test the claim that the proportion of people over 55 who dream in black and white is greater than the proportion for those under 25. An explanation for the results is that those over the age of 55 grew up exposed to media that was displayed in black and white. Can these results be used to verify that explanation? OA. No. The results speak to a possible difference between the proportions of people over 55 and under 25 who dream in black and white, but the results cannot be used to verify the cause of such a difference. OB. No. The results speak to a possible difference between the proportions of people over 55 and under 25 who dream in black and white, but the results are not statistically significant enough to…arrow_forwardA political scientist claims that 38% of first-year college students characterize themselves as being “moderate” or “middle of the road” as far as their political affiliation is concerned. Believing this claimed value is too high, you survey a random sample of 400 first-year college students and find that 120 characterize themselves as being “moderate” or “middle of the road.” Based on this information, what will the test statistic be? Choose the answer below that is closest to what you calculate, and try not to do a lot of rounding until you get to the very end of your calculations. 1. -0.3 2. -1.2 3. -2.6 4. -3.3 5. None of the other answer options are correct because the test statistic should be positive, not negative.arrow_forward
- Assume that matched pairs of data from a poll of Internet users who were asked if they make travel plans through the Internet result in 373 positive signs, 333 negative signs, and 22 ties when the value of the second variable is subtracted from the corresponding value of the first variable. Use the sign test with a 0.10 significance level to test the null hypothesis of no difference. Let ₁ denote the median of the first variable and 12 denote the median of the second variable. Wha are the null and alternative hypotheses? A. Ho: 1₁ #1₂ H₁:1₁ =11₂ C. Ho: 1₁ =1₂ H₁:1₁ <1₂ Find the test statistic. Test statistic = needed.) OB. Ho: 1₁ 2112 H₁:1₁ <1₂ D. Ho: 1₁ =112 H₁:1₁ #1₂ (Round to two decimal places asarrow_forwardPlease help I need in 1 hour thankyouarrow_forwardA certain statistics instructor participates in triathlons. The accompanying table lists times (in minutes and seconds) he recorded while riding a bicycle for five laps through each mile of a 3-mile loop. Use a 0.05 significance level to test the claim that it takes the same time to ride each of the miles. Does one of the miles appear to have a hill? Click the icon to view the data table of the riding times. Determine the null and alternative hypotheses. Ho: H₁: Find the F test statistic. F = Find the P-value using the F test statistic. P-value = What is the conclusion for this hypothesis test? (Round to four decimal places as needed.) (Round to four decimal places as needed.) C O A. Fail to reject Ho. There is insufficient evidence to warrant rejection of the claim that the three different miles have the same mean ride time. O B. Fail to reject Ho. There is sufficient evidence to warrant rejection of the claim that the three different miles have the same mean ride time. O C. Reject…arrow_forward
arrow_back_ios
arrow_forward_ios
Recommended textbooks for you
- MATLAB: An Introduction with ApplicationsStatisticsISBN:9781119256830Author:Amos GilatPublisher:John Wiley & Sons Inc
 Probability and Statistics for Engineering and th...StatisticsISBN:9781305251809Author:Jay L. DevorePublisher:Cengage Learning
 Statistics for The Behavioral Sciences (MindTap C...StatisticsISBN:9781305504912Author:Frederick J Gravetter, Larry B. WallnauPublisher:Cengage Learning
  Elementary Statistics: Picturing the World (7th E...StatisticsISBN:9780134683416Author:Ron Larson, Betsy FarberPublisher:PEARSON
 The Basic Practice of StatisticsStatisticsISBN:9781319042578Author:David S. Moore, William I. Notz, Michael A. FlignerPublisher:W. H. Freeman
 Introduction to the Practice of StatisticsStatisticsISBN:9781319013387Author:David S. Moore, George P. McCabe, Bruce A. CraigPublisher:W. H. Freeman
MATLAB: An Introduction with Applications
Statistics
ISBN:9781119256830
Author:Amos Gilat
Publisher:John Wiley & Sons Inc
Probability and Statistics for Engineering and th...
Statistics
ISBN:9781305251809
Author:Jay L. Devore
Publisher:Cengage Learning
Statistics for The Behavioral Sciences (MindTap C...
Statistics
ISBN:9781305504912
Author:Frederick J Gravetter, Larry B. Wallnau
Publisher:Cengage Learning
Elementary Statistics: Picturing the World (7th E...
Statistics
ISBN:9780134683416
Author:Ron Larson, Betsy Farber
Publisher:PEARSON
The Basic Practice of Statistics
Statistics
ISBN:9781319042578
Author:David S. Moore, William I. Notz, Michael A. Fligner
Publisher:W. H. Freeman
Introduction to the Practice of Statistics
Statistics
ISBN:9781319013387
Author:David S. Moore, George P. McCabe, Bruce A. Craig
Publisher:W. H. Freeman