
MATLAB: An Introduction with Applications
6th Edition
ISBN: 9781119256830
Author: Amos Gilat
Publisher: John Wiley & Sons Inc
expand_more
expand_more
format_list_bulleted
Related questions
Question

Transcribed Image Text:←
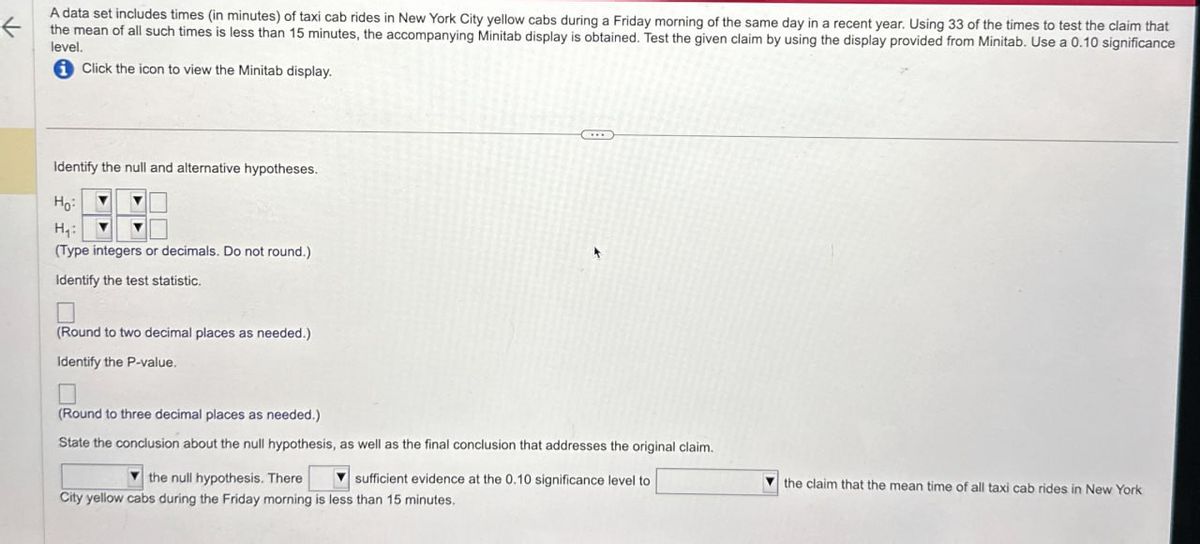
A data set includes times (in minutes) of taxi cab rides in New York City yellow cabs during a Friday morning of the same day in a recent year. Using 33 of the times to test the claim that
the mean of all such times is less than 15 minutes, the accompanying Minitab display is obtained. Test the given claim by using the display provided from Minitab. Use a 0.10 significance
level.
⑪Click the icon to view the Minitab display.
Identify the null and alternative hypotheses.
Ho
H₁:
(Type integers or decimals. Do not round.)
Identify the test statistic.
(Round to two decimal places as needed.)
Identify the P-value.
(Round to three decimal places as needed.)
State the conclusion about the null hypothesis, as well as the final conclusion that addresses the original claim.
the null hypothesis. There
sufficient evidence at the 0.10 significance level to
City yellow cabs during the Friday morning is less than 15 minutes.
the claim that the mean time of all taxi cab rides in New York
Expert Solution
This question has been solved!
Explore an expertly crafted, step-by-step solution for a thorough understanding of key concepts.

Step by stepSolved in 2 steps

Knowledge Booster

Similar questions
- Using the z-scores you found, who is more likely to score 10 points in a game the Goodyear Silents' or their opponents and why? A. The Goodyear Silents would have a z-score furtherest from the mean so they are most likely B. Their opponents have a z-score furtherest from the mean so they are most likely C. The Goodyear Silents would have a z-score closest to the mean so they are most likely D. Their opponents have a z-score closest to the mean so they are most likelyarrow_forwardA consumer advocacy group tests the mean vitamin C content of 50 different brands of bottled juices using, in each case, a t-test of significance in which the null hypothesis is the mean a mount of vitamin C that is on the nutrition facts label for that brand of juice. They find that two of the 50 juice brands have statistically significantly lower Vitamin C than claimed at the 0.05 level. Is this an important discovery? Explain.arrow_forwardA commuter travels many miles to work each morning. She has timed this trip 5 times during the last month. The time (in minutes) required to make this trip was 34, 39, 41, 35, and 41. The mean time (in minutes) required for this trip was _______. 35 41 38 37.5 35.5arrow_forward
- The mean price of a cup of coffee in Portland, OR is $3.94. The owner of a new coffee house believes that the mean price of coffee is different in their neighborhood. A sample of 8 coffee prices from other local coffee shops in their area are shown below. Price 4.2 2.15 3.35 3.5 2.25 2.4 3.9 3.4 Test the claim that mean price of a cup of coffee is not equal to $3.94 using a 5% level of significance. Assume that the coffee prices are normally distributed. Give answers to at least 2 decimal places. a) Fill in the hypotheses below: H0: H1: b) The p-value is 0.0234. The correct decision is to: The correct summary would be: sufficient, insufficient or not enough evidence to reject the claimarrow_forwardEspañol A coin-operated coffee machine made by BIG Corporation was designed to discharge a mean of 7.2 ounces of coffee per cup. BIG has good reason to believe that the mean amount of coffee dispensed by the machine, u, is greater than 7.2 ounces, and plans to do a statistical test of the claim that the machine is working as designed. Technicians gather a random sample of fill amounts and find that the mean of the sample is 7.6 ounces and that the standard deviation is 0.5 ounces. Based on this information, complete the parts below. (a) What are the null hypothesis H. and the alternative hypothesis H, that should be used for the test? Ho :0 Oarrow_forwardCompute the mean of these numbers: 12, 18, 12, 12, 18, 12, 18, 18, 18, 12 (hint: use weighted mean formula)arrow_forward
- Please do not give solution in image formate thanku. A school psychologist wants to determine if reprimanding in public (in front of the class) or private is more effective for curbing behavior. He randomly selects 12 students whose teachers reprimand in private and 12 students whose teachers reprimand in public. At the end of the year he determines the number of misbehaviors for each student. For the public condition and mean=7.7 and s=4.1 for the private condition mean=4.2 and s=3.5. Which method is more effective? What is the percentage of variance accounted for by the method of reprimand? What is the power of your test?arrow_forwardThe first pic is the question. Since some tutors have been solving the problems wrong recently (no judgment), I’ve added a sample question to solve problem.arrow_forwardd. Interpret the value of IQR in the above table.arrow_forward
arrow_back_ios
arrow_forward_ios
Recommended textbooks for you
- MATLAB: An Introduction with ApplicationsStatisticsISBN:9781119256830Author:Amos GilatPublisher:John Wiley & Sons Inc
 Probability and Statistics for Engineering and th...StatisticsISBN:9781305251809Author:Jay L. DevorePublisher:Cengage Learning
 Statistics for The Behavioral Sciences (MindTap C...StatisticsISBN:9781305504912Author:Frederick J Gravetter, Larry B. WallnauPublisher:Cengage Learning
  Elementary Statistics: Picturing the World (7th E...StatisticsISBN:9780134683416Author:Ron Larson, Betsy FarberPublisher:PEARSON
 The Basic Practice of StatisticsStatisticsISBN:9781319042578Author:David S. Moore, William I. Notz, Michael A. FlignerPublisher:W. H. Freeman
 Introduction to the Practice of StatisticsStatisticsISBN:9781319013387Author:David S. Moore, George P. McCabe, Bruce A. CraigPublisher:W. H. Freeman
MATLAB: An Introduction with Applications
Statistics
ISBN:9781119256830
Author:Amos Gilat
Publisher:John Wiley & Sons Inc
Probability and Statistics for Engineering and th...
Statistics
ISBN:9781305251809
Author:Jay L. Devore
Publisher:Cengage Learning
Statistics for The Behavioral Sciences (MindTap C...
Statistics
ISBN:9781305504912
Author:Frederick J Gravetter, Larry B. Wallnau
Publisher:Cengage Learning
Elementary Statistics: Picturing the World (7th E...
Statistics
ISBN:9780134683416
Author:Ron Larson, Betsy Farber
Publisher:PEARSON
The Basic Practice of Statistics
Statistics
ISBN:9781319042578
Author:David S. Moore, William I. Notz, Michael A. Fligner
Publisher:W. H. Freeman
Introduction to the Practice of Statistics
Statistics
ISBN:9781319013387
Author:David S. Moore, George P. McCabe, Bruce A. Craig
Publisher:W. H. Freeman