MATLAB: An Introduction with Applications
6th Edition
ISBN: 9781119256830
Author: Amos Gilat
Publisher: John Wiley & Sons Inc
expand_more
expand_more
format_list_bulleted
Question

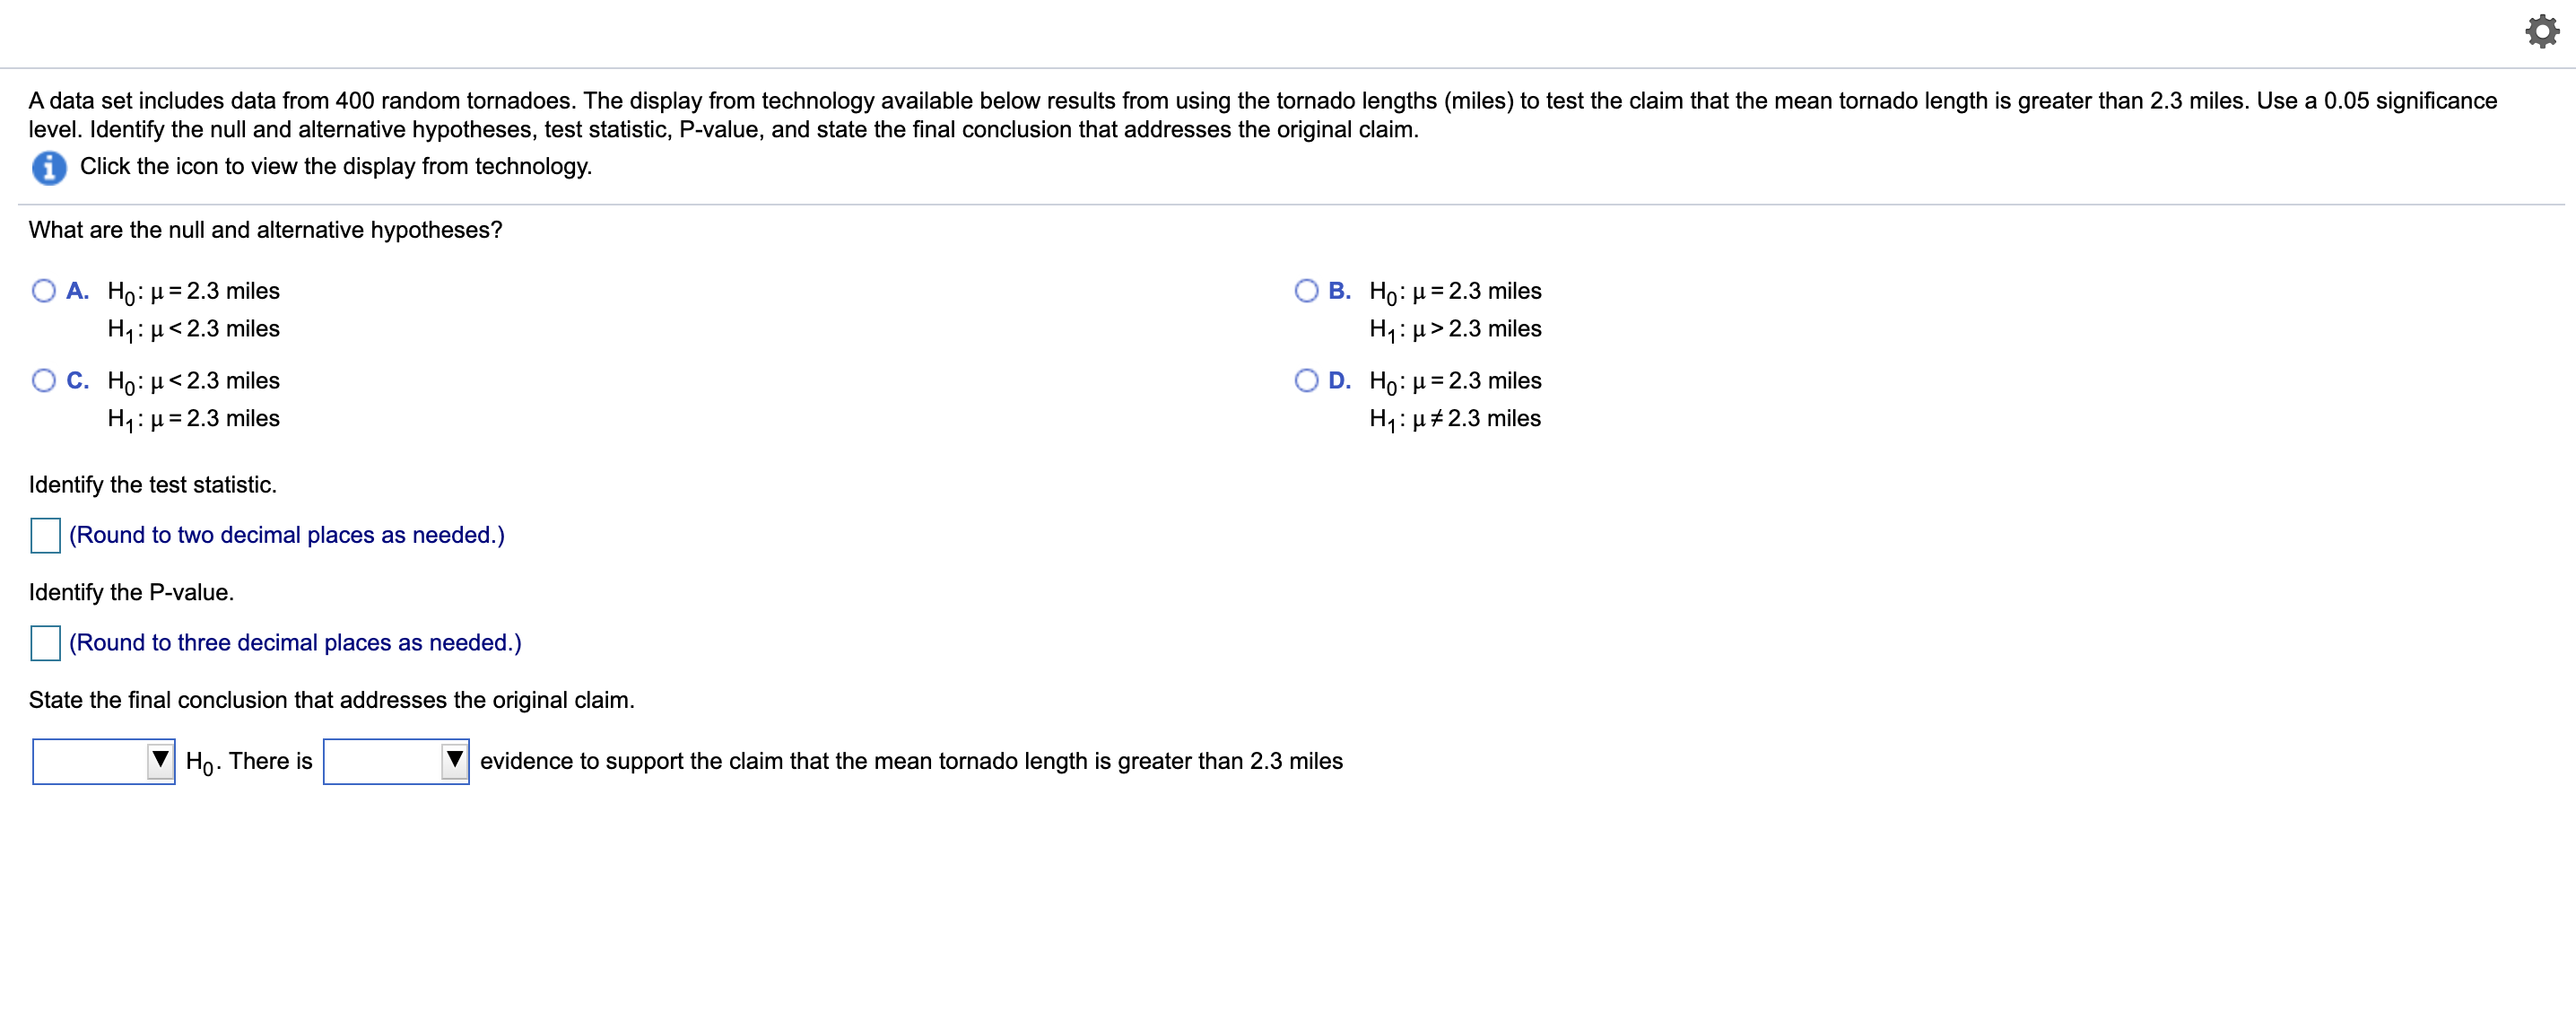
Transcribed Image Text:A data set includes data from 400 random tornadoes. The display from technology available below results from using the tornado lengths (miles) to test the claim that the mean tornado length is greater than 2.3 miles. Use a 0.05 significance
level. Identify the null and alternative hypotheses, test statistic, P-value, and state the final conclusion that addresses the original claim.
Click the icon to view the display from technology.
What are the null and alternative hypotheses?
A. Ho: µ = 2.3 miles
H1: µ< 2.3 miles
B. Ho: µ = 2.3 miles
H1: µ> 2.3 miles
C. Ho: µ< 2.3 miles
H1: µ= 2.3 miles
D. Ho: µ = 2.3 miles
H1: µ#2.3 miles
Identify the test statistic.
(Round to two decimal places as needed.)
Identify the P-value.
(Round to three decimal places as needed.)
State the final conclusion that addresses the original claim.
Ho. There is
evidence to support the claim that the mean tornado length is greater than 2.3 miles

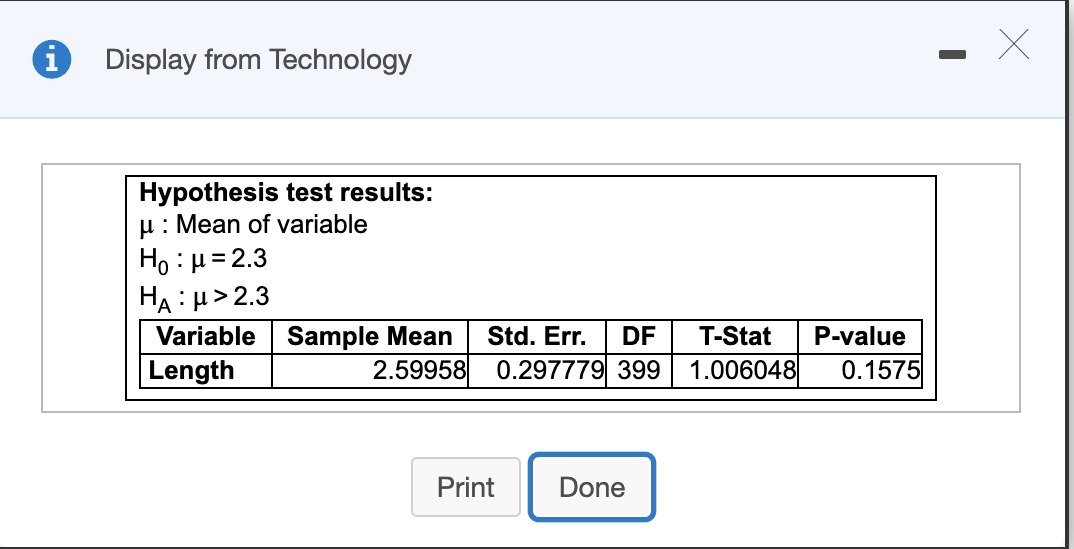
Transcribed Image Text:Display from Technology
Hypothesis test results:
u: Mean of variable
Ho : µ= 2.3
HA : H> 2.3
Variable Sample Mean
Length
Std. Err.
DF
T-Stat
P-value
2.59958 0.297779 399
1.006048
0.1575
Print
Done
Expert Solution
This question has been solved!
Explore an expertly crafted, step-by-step solution for a thorough understanding of key concepts.
This is a popular solution
Trending nowThis is a popular solution!
Step by stepSolved in 2 steps

Knowledge Booster
Similar questions
- Past studies have indicated that the percentage of smokers was estimated to be about 34%. Given the new smoking cessation programs that have been implemented, you now believe that the percentage of smokers has reduced. You randomly surveyed 1708 people and found that 544 smoke. Use a 0.05 significance level to test the claim that the percentage of smokers has reduced.a) Identify the null and alternative hypotheses?H0H0: H1H1: b) What type of hypothesis test should you conduct (left-, right-, or two-tailed)? left-tailed right-tailed two-tailed c) Identify the appropriate significance level.d) Calculate your test statistic (Use ˆpp^ rounded to 4 decimal places). Write the result below, and round your test statistic to 4 decimal places.e) Calculate your p-value. Write the result below, rounded to four decimal places.f) Do you reject the null hypothesis? We reject the null hypothesis, since the p-value is less than the significance level. We reject the…arrow_forwardAn online poll asked: "Do you believe the Loch Ness monster exists?" Among 22,007 responses, 67% were "yes." Use a 0.05 significance level to test the claim that most people believe that the Loch Ness monster exists. How is the conclusion affected by the fact that Internet users who saw the question could decide whether torespond? Find test statistic Identify p value Identify conclusionarrow_forwardProvide a significance level and explain how the confidence levels, C, are different for one and two tail tests. Provide pictures (with areas labeled) to support each C.arrow_forward
- A data set includes data from 500 random tornadoes. The display from technology available below results from using the tornado lengths (miles) to test the claim that the mean tornado length is greater than 2.4 miles. Use a 0.05 significance level. Identify the null and alternative hypotheses, test statistic, P-value, and state the final conclusion that addresses the original claim. i Click the icon to view the display from technology. Assuming all conditions for conducting a hypothesis test are met, what are the null and alternative hypotheses? O A. Ho: μ=2.4 miles O B. Ho: μ=2.4 miles H₁: μ#2.4 miles H₁: μ 2.4 miles Identify the test statistic. (Round to two decimal places as needed.) Identify the P-value. (Round to three decimal places as needed.) State the final conclusion that addresses the original claim. Ho. There is greater than 2.4 miles evidence to support the claim that the mean tornado length isarrow_forwardPlease answer FULL questionarrow_forwardThe US Department of Energy reported that 48% of homes were heated by natural gas. A random sample of 336 homes in Oregon found that 142 were heated by natural gas. Test the claim that proportion of homes in Oregon that were heated by natural gas is different than what was reported. Use a 10% significance level. Give answer to at least 4 decimal places. What are the correct hypotheses? (Select the correct symbols and use decimal values not percentages.) Based on the hypotheses, compute the following:Test Statistic = p-value =arrow_forward
- Does more than 60% of teenagers jog? A survey states, 63% of 45,574 of teenagers surveyed do jog. Use a test of hypothesis to test the validity of the claim. State your conclusion in the context of the problem. ( asssume significance levela = 0.01). Be sure to check the validity of the inferences prior to using the concept.arrow_forwardA data set includes data from 500 random tornadoes. The display from technology available below results from using the tornado lengths (miles) to test the claim that the mean tornado length is greater than 2.5 miles. Use a 0.05 significance level. Identify the null and alternative hypotheses, test statistic, P-value, and state the final conclusion that addresses the original claim. Click the icon to view the display from technology. Assuming all conditions for conducting a hypothesis test are met, what are the null and alternative hypotheses? O A. Ho: µ=2.5 miles O B. Ho: H= 2.5 miles H,: µ#2.5 miles H,: µ> 2.5 miles Ο C. H : μ < 25 miles O D. Ho: µ=2.5 miles H;: µ<2.5 miles H,: µ=2.5 milesarrow_forwardIdentify the test statistic. Identify the P-value. State the final conclusion that addresses the original claim.arrow_forward
- please help solve attachedarrow_forwardUse a 0.05 significance level to test the claim that pedestrian fatalities are independent of the intoxication of the driver and the intoxication of the pedestrian. Use the traditional method. Be sure to include all the expected values in the chart. List the null and alternative hypotheses, the critical value, the test statistic, Draw the graph and label the test statistic, critical value, and rejection regions. Reject or fail to reject? State the conclusion as outlined in the template or book Pedestrian Intoxicated Expected Value Pedestrian not intoxicated Expected Value Totals Driver Intoxicated 59 79 Driver not Intoxicated 266 581 Totalsarrow_forward
arrow_back_ios
arrow_forward_ios
Recommended textbooks for you
 MATLAB: An Introduction with ApplicationsStatisticsISBN:9781119256830Author:Amos GilatPublisher:John Wiley & Sons Inc
 Probability and Statistics for Engineering and th...StatisticsISBN:9781305251809Author:Jay L. DevorePublisher:Cengage Learning
 Statistics for The Behavioral Sciences (MindTap C...StatisticsISBN:9781305504912Author:Frederick J Gravetter, Larry B. WallnauPublisher:Cengage Learning
 Elementary Statistics: Picturing the World (7th E...StatisticsISBN:9780134683416Author:Ron Larson, Betsy FarberPublisher:PEARSON
 The Basic Practice of StatisticsStatisticsISBN:9781319042578Author:David S. Moore, William I. Notz, Michael A. FlignerPublisher:W. H. Freeman
 Introduction to the Practice of StatisticsStatisticsISBN:9781319013387Author:David S. Moore, George P. McCabe, Bruce A. CraigPublisher:W. H. Freeman

MATLAB: An Introduction with Applications
Statistics
ISBN:9781119256830
Author:Amos Gilat
Publisher:John Wiley & Sons Inc

Probability and Statistics for Engineering and th...
Statistics
ISBN:9781305251809
Author:Jay L. Devore
Publisher:Cengage Learning

Statistics for The Behavioral Sciences (MindTap C...
Statistics
ISBN:9781305504912
Author:Frederick J Gravetter, Larry B. Wallnau
Publisher:Cengage Learning

Elementary Statistics: Picturing the World (7th E...
Statistics
ISBN:9780134683416
Author:Ron Larson, Betsy Farber
Publisher:PEARSON

The Basic Practice of Statistics
Statistics
ISBN:9781319042578
Author:David S. Moore, William I. Notz, Michael A. Fligner
Publisher:W. H. Freeman

Introduction to the Practice of Statistics
Statistics
ISBN:9781319013387
Author:David S. Moore, George P. McCabe, Bruce A. Craig
Publisher:W. H. Freeman