MATLAB: An Introduction with Applications
6th Edition
ISBN: 9781119256830
Author: Amos Gilat
Publisher: John Wiley & Sons Inc
expand_more
expand_more
format_list_bulleted
Topic Video
Question

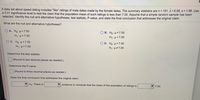
Transcribed Image Text:A data set about speed dating includes "like" ratings of male dates made by the female dates. The summary statistics are n= 191, x= 6.58, s = 1.96. Use
a 0.01 significance level to test the claim that the population mean of such ratings is less than 7.00. Assume that a simple random sample has been
selected. Identify the null and alternative hypotheses, test statistic, P-value, and state the final conclusion that addresses the original claim.
What are the null and alternative hypotheses?
Ο Α. H μ=7.00
O B. Ho: µ= 7.00
H4: µ>7.00
H1:µ<7.00
OC. Ho: H<7.00
O D. Ho: u = 7.00
H1: µ>7.00
H1:H#7.00
Determine the test statistic.
(Round to two decimal places as needed.)
Determine the P-value.
|(Round to three decimal places as needed.)
ate the final conclusion that addresses the original claim.
V Ho- There is
V evidence to conclude that the mean of the population of ratings is
V 7.00.
Expert Solution
This question has been solved!
Explore an expertly crafted, step-by-step solution for a thorough understanding of key concepts.
This is a popular solution
Trending nowThis is a popular solution!
Step by stepSolved in 2 steps with 1 images

Knowledge Booster
Learn more about
Need a deep-dive on the concept behind this application? Look no further. Learn more about this topic, statistics and related others by exploring similar questions and additional content below.Similar questions
- Use technology to help you test the claim about the population mean, u, at the given level of significance, a, using the given sample statistics. Assume the population is normally distributed. Claim: us1160; a= 0.08; o = 198.07. Sample statistics: x = 1182.77, n = 275 %3D Identify the null and alternative hypotheses. Choose the correct answer below. O A. Ho: u> 1160 Hai HS1160 O B. Ho: p21182.77 HgiH 1160 O D. Ho: us1182.77 Ha:u> 1182.77 O E. Ho: u21160 Ha: µ1182.77 H3: µs 1182.77 Calculate the standardized test statistic. The standardized test statistic is. (Round to two decimal places as needed.) Determine the P-value. = (Round to three decimal places as needed.) Determine the outcome and conclusion of the test. enough evidence to Vthe claim. Ho. At the 8% significance level, therearrow_forwardAnswer all these questions correctly thanks.arrow_forwardAssume that the heights of women are normally distributed. A random sample of 20 women have a mean height of 62.5 inches and a standard deviation of 1.3 inches. Construct a 98% confidence interval for the population variance, .arrow_forward
- The average gold content from an ore sample in 36 different locations is found to be 2.6 grams per ton. a. Find the 95% and 99% confidence intervals for the mean gold content in that area. Assume that the population variance is 0.09.arrow_forwardThe accompanying table lists pulse rates. Use a 0.05 significance level and apply the methods of two-way analysis of variance. What is the conclusion? Click on the icon to view the data table. C State the null and alternative hypotheses in the test for the effect of an interaction between row and column factors. Ho: There is no interaction between gender and age. H₁: There is an interaction between gender and age. What is the value of the test statistic for this test? F = 3.32 (Round to two decimal places as needed.) What is the corresponding P-value of the test statistic, F, for this P-value= (Round to three decimal places as needed.) Pulse Rates for Gender and Age Over 30 Years of Age Under 30 Years of Age Female 78 103 78 63 61 98 81 98 91 95 77 75 73 65 71 78 61 71 74 55 Female Male 60 81 56 69 68 74 75 68 63 56 46 70 61 65 91 80 59 58 64 59 Male D Xarrow_forwardRefer to the sample data for pre-employment drug screening shown below. If one of the subjects is randomly selected, what is the probability that the test result is a false positive? Who would suffer from a false positive result? Why? Positive test result Negative test result Drug Use Is Indicated Drug Use Is Not Indicated Subject Uses Drugs 39 14 Subject Is Not a Drug User 2 36 Pre-Employment Drug Screening Results The probability of a false positive test result is (Round to three decimal places as needed.)arrow_forward
arrow_back_ios
arrow_forward_ios
Recommended textbooks for you
 MATLAB: An Introduction with ApplicationsStatisticsISBN:9781119256830Author:Amos GilatPublisher:John Wiley & Sons Inc
 Probability and Statistics for Engineering and th...StatisticsISBN:9781305251809Author:Jay L. DevorePublisher:Cengage Learning
 Statistics for The Behavioral Sciences (MindTap C...StatisticsISBN:9781305504912Author:Frederick J Gravetter, Larry B. WallnauPublisher:Cengage Learning
 Elementary Statistics: Picturing the World (7th E...StatisticsISBN:9780134683416Author:Ron Larson, Betsy FarberPublisher:PEARSON
 The Basic Practice of StatisticsStatisticsISBN:9781319042578Author:David S. Moore, William I. Notz, Michael A. FlignerPublisher:W. H. Freeman
 Introduction to the Practice of StatisticsStatisticsISBN:9781319013387Author:David S. Moore, George P. McCabe, Bruce A. CraigPublisher:W. H. Freeman

MATLAB: An Introduction with Applications
Statistics
ISBN:9781119256830
Author:Amos Gilat
Publisher:John Wiley & Sons Inc

Probability and Statistics for Engineering and th...
Statistics
ISBN:9781305251809
Author:Jay L. Devore
Publisher:Cengage Learning

Statistics for The Behavioral Sciences (MindTap C...
Statistics
ISBN:9781305504912
Author:Frederick J Gravetter, Larry B. Wallnau
Publisher:Cengage Learning

Elementary Statistics: Picturing the World (7th E...
Statistics
ISBN:9780134683416
Author:Ron Larson, Betsy Farber
Publisher:PEARSON

The Basic Practice of Statistics
Statistics
ISBN:9781319042578
Author:David S. Moore, William I. Notz, Michael A. Fligner
Publisher:W. H. Freeman

Introduction to the Practice of Statistics
Statistics
ISBN:9781319013387
Author:David S. Moore, George P. McCabe, Bruce A. Craig
Publisher:W. H. Freeman