MATLAB: An Introduction with Applications
6th Edition
ISBN: 9781119256830
Author: Amos Gilat
Publisher: John Wiley & Sons Inc
expand_more
expand_more
format_list_bulleted
Question

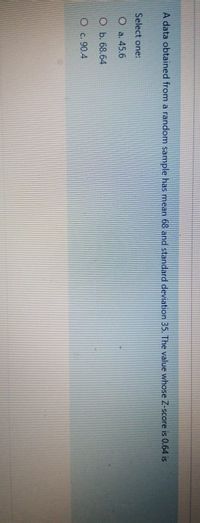
Transcribed Image Text:A data obtained from a random sample has mean 68 and standard deviation 35. The value whose Z-score is 0.64 is
Select one:
O a. 45.6
O b. 68.64
Oc. 90.4
Expert Solution
This question has been solved!
Explore an expertly crafted, step-by-step solution for a thorough understanding of key concepts.
Step by stepSolved in 2 steps with 2 images

Knowledge Booster
Similar questions
- Use sample standard deviation formula to find the standard deviation of these BMI’s: 33.3, 28, 45.4, 28.4 and 25.9.arrow_forwardThe standard deviation of the distribution of sample means would be equal to:arrow_forwardThe standard deviation of the population of IQ Scores is standardized to be 15 points. Calculate the standard error of the mean(nearest hundredth place) for: A sample of size of 81 A sample size of 4arrow_forward
- The amount of calories consumed by customers at the Chinese buffet is normally distributed with mean 2967 and standard deviation 539. One randomly selected customer is observed to see how many calories X that customer consumes. Round all answers to 4 decimal places where possible.b. Find the probability that the customer consumes less than 2600 calories. c. What proportion of the customers consume over 3342 calories? d. The Piggy award will given out to the 2% of customers who consume the most calories. What is the fewest number of calories a person must consume to receive the Piggy award? calories. (Round to the nearest calorie)arrow_forwardMost people think that the "normal" adult body temperature is 98.6°F. In a more recent study, researchers reported that a more accurate figure may be 98.1°F. Furthermore, the standard deviation appeared to be around 0.7°F. Assume that a Normal model is appropriate. b) What fraction of people would be expected to have body temperatures above 98.6°F?arrow_forwardThe graph of a normal curve is shown below. 49 + 57 μ = + 65 73 and o = + 81 + 89 Based on this graph, give the values of the mean and standard deviation of the distribution. 97arrow_forward
- Assume the heights of faculty at Champlain College are normally distributed with a mean of 68.1 inchesand a standard deviation of 1.3 inches. Which of the following values best approximates the probabilityof randomly selecting a Champlain College faculty membershorterthan 67.5 inches tall?A. 0.0668B. 0.3228C. 0.5001D. 0.6772E. 0.9332arrow_forwardA population has a normal distribution with a mean of 32.9 and a standard deviation of 35.2. Draw 4. a normal curve with labels, shading, and what you entered into the calculator for full credit. Round your answer to 4 decimal places. Find the probability that a randomly selected item is between 27.5 and 40.6 a) Find the probability that a sample size of 25 is randomly selected and is less than 28.2. b)arrow_forwardSuppose that you have a four-sided die that is equally weighted (i.e. equal chance of any of the four sides landing face up). The four values on the die are [12.5968, 2, -2 and -12.5968] . What is the standard deviation using the conceptual definition? That is, what is the average distance from the data points to the mean? A. 5.34 B. 4.09 C. 2.58 D. 7.29arrow_forward
- only answer the first three (following bartleby's rules). Note:I will post another question, for you to answer me the remaining exercises, ok?arrow_forwardSuppose that the average number of Facebook friends users have is normally distributed with a mean of 112 and a standard deviation of about 48. Assume forty-six individuals are randomly chosen. Answer the following questions. Round all answers to 4 decimal places where possible. 1. the group of 46, find the probability that the average number of friends is more than 123. 2. Find the first quartile for the average number of Facebook friends.arrow_forward
arrow_back_ios
arrow_forward_ios
Recommended textbooks for you
 MATLAB: An Introduction with ApplicationsStatisticsISBN:9781119256830Author:Amos GilatPublisher:John Wiley & Sons Inc
 Probability and Statistics for Engineering and th...StatisticsISBN:9781305251809Author:Jay L. DevorePublisher:Cengage Learning
 Statistics for The Behavioral Sciences (MindTap C...StatisticsISBN:9781305504912Author:Frederick J Gravetter, Larry B. WallnauPublisher:Cengage Learning
 Elementary Statistics: Picturing the World (7th E...StatisticsISBN:9780134683416Author:Ron Larson, Betsy FarberPublisher:PEARSON
 The Basic Practice of StatisticsStatisticsISBN:9781319042578Author:David S. Moore, William I. Notz, Michael A. FlignerPublisher:W. H. Freeman
 Introduction to the Practice of StatisticsStatisticsISBN:9781319013387Author:David S. Moore, George P. McCabe, Bruce A. CraigPublisher:W. H. Freeman

MATLAB: An Introduction with Applications
Statistics
ISBN:9781119256830
Author:Amos Gilat
Publisher:John Wiley & Sons Inc

Probability and Statistics for Engineering and th...
Statistics
ISBN:9781305251809
Author:Jay L. Devore
Publisher:Cengage Learning

Statistics for The Behavioral Sciences (MindTap C...
Statistics
ISBN:9781305504912
Author:Frederick J Gravetter, Larry B. Wallnau
Publisher:Cengage Learning

Elementary Statistics: Picturing the World (7th E...
Statistics
ISBN:9780134683416
Author:Ron Larson, Betsy Farber
Publisher:PEARSON

The Basic Practice of Statistics
Statistics
ISBN:9781319042578
Author:David S. Moore, William I. Notz, Michael A. Fligner
Publisher:W. H. Freeman

Introduction to the Practice of Statistics
Statistics
ISBN:9781319013387
Author:David S. Moore, George P. McCabe, Bruce A. Craig
Publisher:W. H. Freeman