
MATLAB: An Introduction with Applications
6th Edition
ISBN: 9781119256830
Author: Amos Gilat
Publisher: John Wiley & Sons Inc
expand_more
expand_more
format_list_bulleted
Related questions
Question
Identify the t stastic & the pvalue
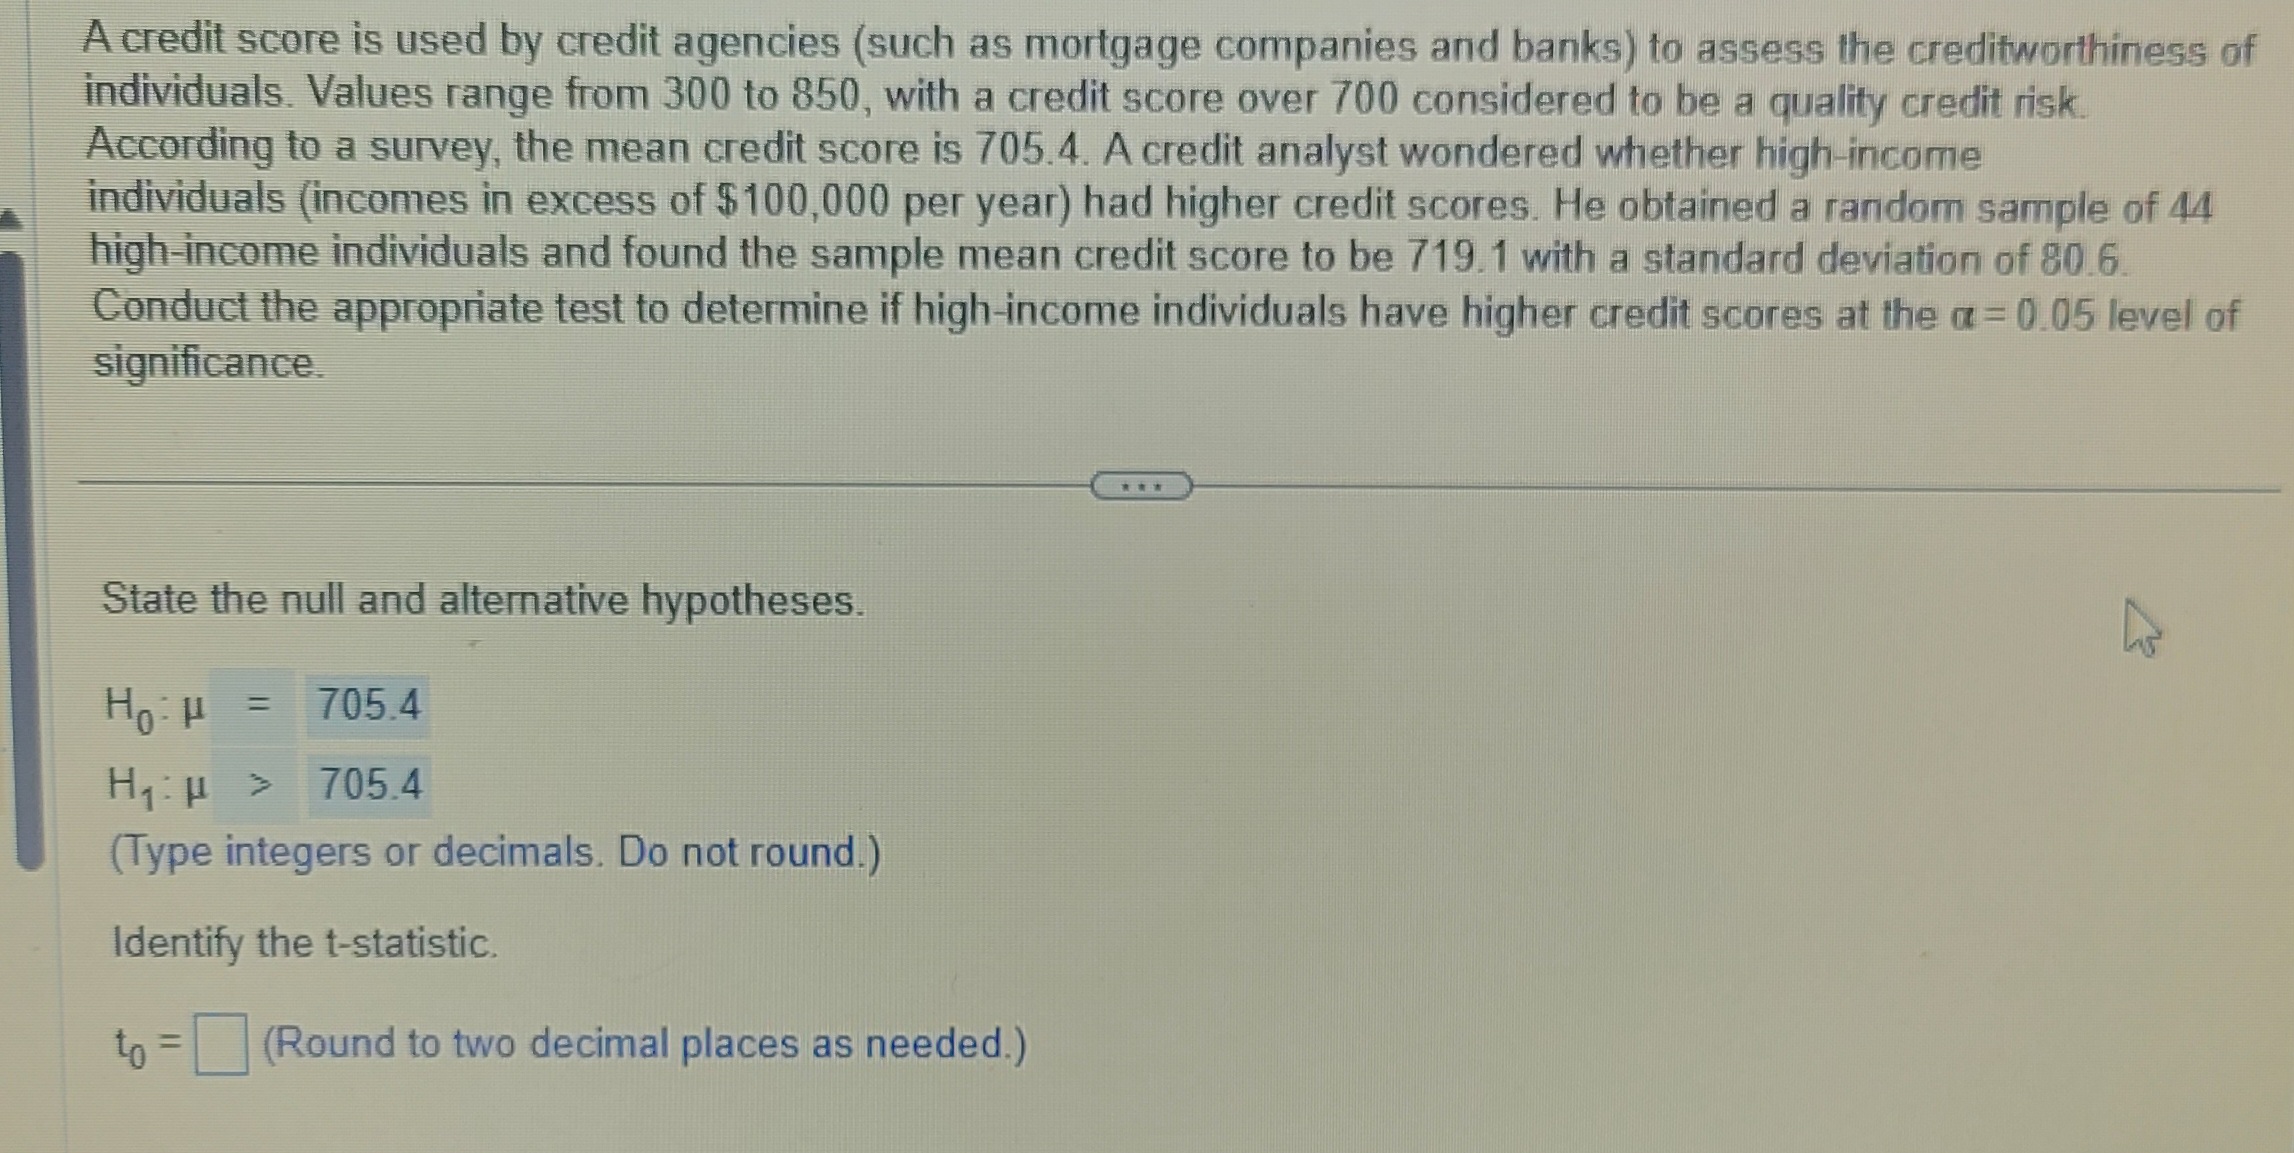

Transcribed Image Text:A credit score is used by credit agencies (such as mortgage companies and banks) to assess the creditworthiness of
individuals. Values range from 300 to 850, with a credit score over 700 considered to be a quality credit risk.
According to a survey, the mean credit score is 705.4. A credit analyst wondered whether high-income
individuals (incomes in excess of $100,000 per year) had higher credit scores. He obtained a random sample of 44
high-income individuals and found the sample mean credit score to be 719.1 with a standard deviation of 80.6.
Conduct the appropriate test to determine if high-income individuals have higher credit scores at the a=0.05 level of
significance.
State the null and alternative hypotheses.
Но н
705.4
H₁:µ > 705.4
(Type integers or decimals. Do not round.)
Identify the t-statistic.
to = (Round to two decimal places as needed.)
Expert Solution
This question has been solved!
Explore an expertly crafted, step-by-step solution for a thorough understanding of key concepts.

This is a popular solution

Trending nowThis is a popular solution!

Step by stepSolved in 4 steps with 5 images

Knowledge Booster

Similar questions
- q6b-arrow_forwardSuppose that earthquakes occur according to a Poisson process with rate λ = 0.2 per day. (a) What is the probability that there will be 2 or fewer earthquakes in April? (b) Starting from now, what is the probability that the second earthquake will occur within a week?arrow_forwardWhat is the probability that a car waits more than 3 minutes at the inspection station?arrow_forward
- 1a) Derive a maximum-liklihood estimator for the unknown parameter Y 1b) An experienced sales person completes sales following a Poisson distribution, with a mean rate of Y = 1.8 sales/month. A junior sales person completes sales at a mean rate of Y = 0.85 sales per month Find the probability of the joint sales team (experienced and junior) completing exactly 2 sales in any given months, assuming the two sales people act independently of each other. 1c) Find the probability of the joint sales team (experienced and junior) completing more than 2 sales in any given monthsarrow_forwardChains "A" and "B" are made of the same steel. "A" consists of three links and "B" consists of six links, each link having a normal distribution function of the resisting strength with a mean of 60,000 psi and standard deviation of 5,000 psi. Determine which chain is generally weaker (from a probabilistic point of view) by plotting the probability distribution functions of their resisting strengths on the same diagram.arrow_forward7arrow_forward
- A disk drive has a constant failure rate and an MTTF of 5000 hr. (a) What will the probability of failure be for one year of operation? (b) What will the probability of failure be for one year of operation if two of the drives are placed in active parallel and the failures are independent? (d) What will the probability of failure be for one year of operation if the system si changed to standby model. (e) Describe the effect on the MTTF with a switching failure probability of 0.05. () What would be change in MTTF if the probability of failure of standby unit is 10 percent of the failure of the primary unit in the standby mode?arrow_forwardExercise 2. A r.v. X is Poisson distributed with parameter λ = 5.5. (a) Calculate the probability that X = 3. (b) Calculate the probability that X < 2. (c) What is the most likely (i.e. highest probability) value for X ? (You can make a graph of f(x) to find the answer).arrow_forward
arrow_back_ios
arrow_forward_ios
Recommended textbooks for you
- MATLAB: An Introduction with ApplicationsStatisticsISBN:9781119256830Author:Amos GilatPublisher:John Wiley & Sons Inc
 Probability and Statistics for Engineering and th...StatisticsISBN:9781305251809Author:Jay L. DevorePublisher:Cengage Learning
 Statistics for The Behavioral Sciences (MindTap C...StatisticsISBN:9781305504912Author:Frederick J Gravetter, Larry B. WallnauPublisher:Cengage Learning
  Elementary Statistics: Picturing the World (7th E...StatisticsISBN:9780134683416Author:Ron Larson, Betsy FarberPublisher:PEARSON
 The Basic Practice of StatisticsStatisticsISBN:9781319042578Author:David S. Moore, William I. Notz, Michael A. FlignerPublisher:W. H. Freeman
 Introduction to the Practice of StatisticsStatisticsISBN:9781319013387Author:David S. Moore, George P. McCabe, Bruce A. CraigPublisher:W. H. Freeman
MATLAB: An Introduction with Applications
Statistics
ISBN:9781119256830
Author:Amos Gilat
Publisher:John Wiley & Sons Inc
Probability and Statistics for Engineering and th...
Statistics
ISBN:9781305251809
Author:Jay L. Devore
Publisher:Cengage Learning
Statistics for The Behavioral Sciences (MindTap C...
Statistics
ISBN:9781305504912
Author:Frederick J Gravetter, Larry B. Wallnau
Publisher:Cengage Learning
Elementary Statistics: Picturing the World (7th E...
Statistics
ISBN:9780134683416
Author:Ron Larson, Betsy Farber
Publisher:PEARSON
The Basic Practice of Statistics
Statistics
ISBN:9781319042578
Author:David S. Moore, William I. Notz, Michael A. Fligner
Publisher:W. H. Freeman
Introduction to the Practice of Statistics
Statistics
ISBN:9781319013387
Author:David S. Moore, George P. McCabe, Bruce A. Craig
Publisher:W. H. Freeman