
MATLAB: An Introduction with Applications
6th Edition
ISBN: 9781119256830
Author: Amos Gilat
Publisher: John Wiley & Sons Inc
expand_more
expand_more
format_list_bulleted
Related questions
Question

Transcribed Image Text:Student
Name
Jack
Anne
7-11
Harry
Sharon
John
James
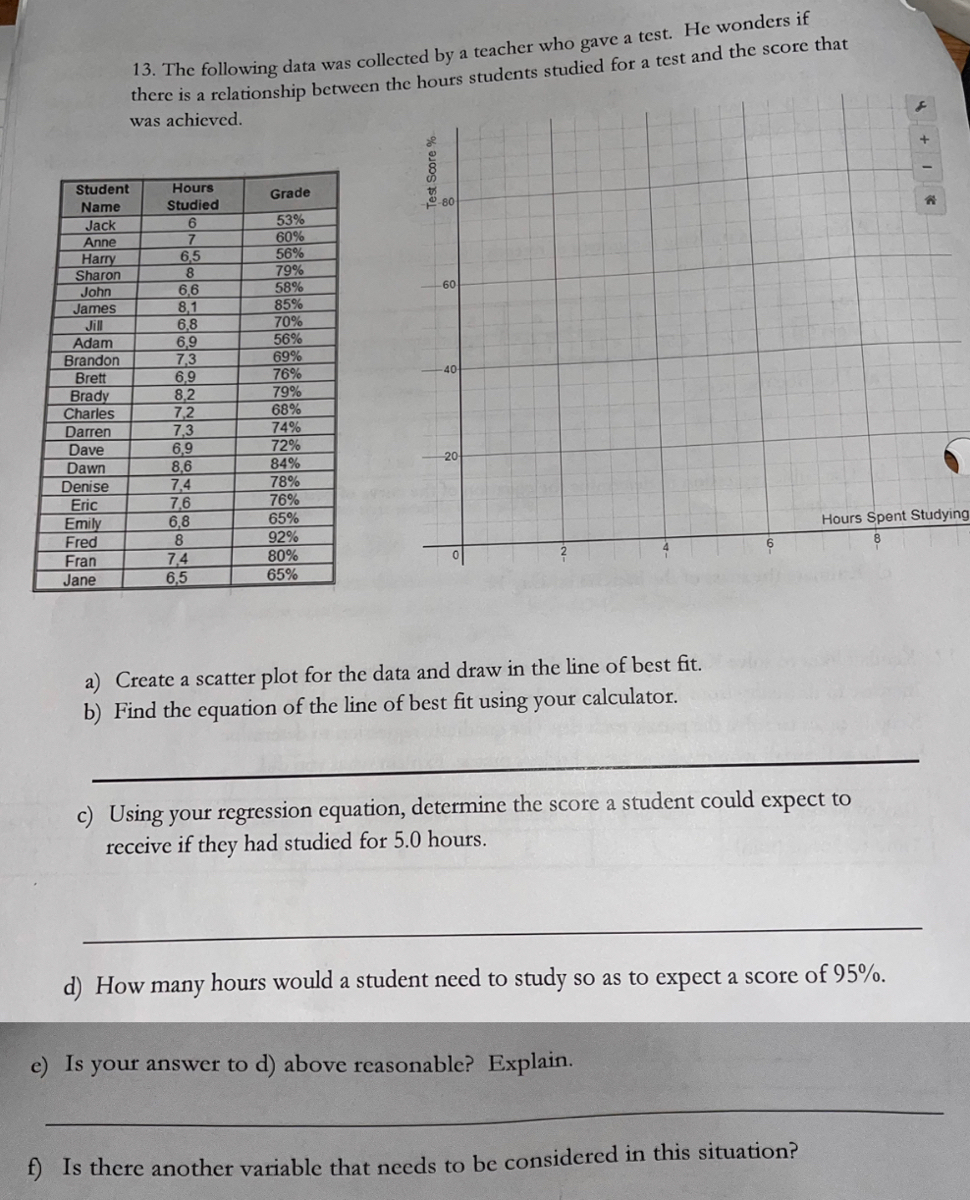
13. The following data was collected by a teacher who gave a test. He wonders if
there is a relationship between the hours students studied for a test and the score that
was achieved.
Adam
Brandon
Brett
Brady
Charles
Darren
Dave
Dawn
Denise
Eric
Emily
Fred
Fran
Jane
Hours
Studied
6
7
6,5
8
6,6
8,1
6,8
6,9
d) How
7,3
6,9
8,2
7,2
7,3
6,9
8,6
7,4
7,6
6,8
8
7,4
6,5
Grade
53%
60%
56%
79%
58%
85%
70%
56%
69%
76%
79%
68%
74%
many.
72%
84%
78%
76%
65%
92%
80%
65%
Test Score 9
a) Create a scatter plot for the data and draw in the line of best fit.
b) Find the equation of the line of best fit using your calculator.
-20
c) Using your regression equation, determine the score a student could expect to
receive if they had studied for 5.0 hours.
hours would a student need to study so as to expect a score of 95%.
e) Is your answer to d) above reasonable? Explain.
Hours Spent Studying
f) Is there another variable that needs to be considered in this situation?
* I+
Expert Solution
This question has been solved!
Explore an expertly crafted, step-by-step solution for a thorough understanding of key concepts.

Step by stepSolved in 2 steps with 3 images

Knowledge Booster

Similar questions
- Refer to the data set: x -1 1 -2 3 0 2 y 9 2 15 1 4 1.5 Part a: Make a scatterplot and determine which type of model best fits the data.Part b: Find the regression equation, round decimals to one place.Part c: Use the equation from Part b to determine y when x = 5.arrow_forwardRefer to the Baseball 2018 data, which reports information on the 2018 Major League Baseball season. Let attendance be the dependent variable and total team salary be the independent variable. Determine the regression equation and answer the following questions. Click here for the Excel Data Filea-1. Draw a scatter diagram.1. On the graph below, use the point tool to plot the point corresponding to the Attendance and its team salary (Salary 1).2. Repeat the process for the remainder of the sample Salary 2, Salary 3, … ).3. To enter exact coordinates, double-click on the point and enter the exact coordinates of x and y. a-2. From the diagram, does there seem to be a direct relationship between the two variables?multiple choice 1 Yes No b. What is the expected attendance for a team with a salary of $100.0 million? (Round your answer to 4 decimal places.) c. If the owners pay an additional $30 million, how many more people could they expect to attend? (Round your answer to 3…arrow_forwardMary used a sample of 68 large U.S. cities to estimate the relationship between Crime (annual property crimes per 100,000 persons) and Income (median annual income per capita, in dollars). Her estimated regression equation was Crime = 428 + 0.050 Income. If Income decreases by 500, we would expect that Crime will Group of answer choices remain unchanged. decrease by 25. increase by 500. decrease by 50.arrow_forward
- The arm span and foot length were both measured (in centimeters) for each of 20 students in a biology class. The computer output displays the regression analysis. Which of the following is the best interpretation of the coefficient of determination r2? About 37% of the variation in arm span is accounted for by the linear relationship formed with the foot length. About 65% of the variation in foot length is accounted for by the linear relationship formed with the arm span. About 63% of the variation in arm span is accounted for by the linear relationship formed with the foot length. About 63% of the variation in foot length is accounted for by the linear relationship formed with the arm span.arrow_forwardPart a: Make a scatter plot and determine which type of model best fits the data.Part b: Find the regression equation.Part c: Use the equation from Part b to determine y when x = 1.5.arrow_forwardA pediatrician wants to determine the relation that exists between a child's height (x) and head circumference (y). She randomly selects 11 children from her practice and measures their height and head circumference in inches. She finds that the correlation is 0.694, and the regression equation is y = 0.294x + 2.02. What proportion of the variation in head circumference can be explained by the variation in the values of height? Round your answer to three decimal places. %arrow_forward
- Using your favorite statistics software package, you generate a scatter plot with a regression equation and correlation coefficient. The regression equation is reported as y = – 65.95x + 49.28 and the r = - 0.993. What proportion of the variation in y can be explained by the variation in the values of x? r2 = Report answer as a percentage accurate to one decimal place.arrow_forwardA. Develop an estimated regression equation that can be used to predict the price of the stock based on the number of shares of company's stocks sold and the volume of exchange. B. Interpret the coefficients of the estimated regression equation that you found in Part a. C. If in a given day, the number of shares of the company that were sold was 94,500 and the volume of exchange on the New York Stock Exchange was 16 million, what would you expect the price of the stock to be?arrow_forward
arrow_back_ios
arrow_forward_ios
Recommended textbooks for you
- MATLAB: An Introduction with ApplicationsStatisticsISBN:9781119256830Author:Amos GilatPublisher:John Wiley & Sons Inc
 Probability and Statistics for Engineering and th...StatisticsISBN:9781305251809Author:Jay L. DevorePublisher:Cengage Learning
 Statistics for The Behavioral Sciences (MindTap C...StatisticsISBN:9781305504912Author:Frederick J Gravetter, Larry B. WallnauPublisher:Cengage Learning
  Elementary Statistics: Picturing the World (7th E...StatisticsISBN:9780134683416Author:Ron Larson, Betsy FarberPublisher:PEARSON
 The Basic Practice of StatisticsStatisticsISBN:9781319042578Author:David S. Moore, William I. Notz, Michael A. FlignerPublisher:W. H. Freeman
 Introduction to the Practice of StatisticsStatisticsISBN:9781319013387Author:David S. Moore, George P. McCabe, Bruce A. CraigPublisher:W. H. Freeman
MATLAB: An Introduction with Applications
Statistics
ISBN:9781119256830
Author:Amos Gilat
Publisher:John Wiley & Sons Inc
Probability and Statistics for Engineering and th...
Statistics
ISBN:9781305251809
Author:Jay L. Devore
Publisher:Cengage Learning
Statistics for The Behavioral Sciences (MindTap C...
Statistics
ISBN:9781305504912
Author:Frederick J Gravetter, Larry B. Wallnau
Publisher:Cengage Learning
Elementary Statistics: Picturing the World (7th E...
Statistics
ISBN:9780134683416
Author:Ron Larson, Betsy Farber
Publisher:PEARSON
The Basic Practice of Statistics
Statistics
ISBN:9781319042578
Author:David S. Moore, William I. Notz, Michael A. Fligner
Publisher:W. H. Freeman
Introduction to the Practice of Statistics
Statistics
ISBN:9781319013387
Author:David S. Moore, George P. McCabe, Bruce A. Craig
Publisher:W. H. Freeman