Managerial Accounting
15th Edition
ISBN: 9781337912020
Author: Carl Warren, Ph.d. Cma William B. Tayler
Publisher: South-Western College Pub
expand_more
expand_more
format_list_bulleted
Question
Need correct answer

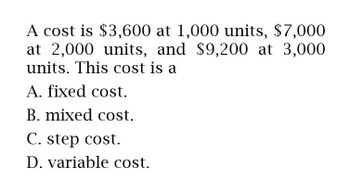
Transcribed Image Text:A cost is $3,600 at 1,000 units, $7,000
at 2,000 units, and $9,200 at 3,000
units. This cost is a
A. fixed cost.
B. mixed cost.
C. step cost.
D. variable cost.
Expert Solution
This question has been solved!
Explore an expertly crafted, step-by-step solution for a thorough understanding of key concepts.
Step by stepSolved in 2 steps

Knowledge Booster
Similar questions
- Tag. General Accountarrow_forwardFrom the below given data, which cost has no relationship with the level of output? Type of cost Amounts (OMR) Total cost 6,000 Variable costs 4,000 Semi variable costs 1,000 Fixed cost 1,000 O a. Variable costs O b. Semi variable costs OC. Total cost Od. Fixed costarrow_forwardGeneral Accountarrow_forward
- Correct Answer✅arrow_forwardGiven the mixed cost function y = $6.50x + $3,000. What does the $6.50 represent? a.Total cost per unit of the cost driver b.The fixed cost per unit c.The slope of the cost function d.Total fixed costsarrow_forwardWhich of the following types of cost is shown in the cost data below? Cost per Number of Unit Units $6,000 3,000 2,000 1,500 a. fixed cost b. mixed cost C. variable cost d. period cost 2. 3. 4.arrow_forward
- Owearrow_forwardThe "x" in the overhead cost equation, y = $5.50x + $92,000, represents which of the following? total overhead costs. the variable costs. total fixed costs. the cost driver in units.arrow_forwardComplete the table below for contribution margin per unit, total contribution margin, and contribution margin ratio: (Click the icon to view the table.) Compute the missing information, starting with scenario A, then for scenarios B and C. (Enter the contribution margin ratio to nearest percent, X%.) A B C 1,290 units 14,390 units 3,600 units 1,400 4,400 $ 1,250 700 880 625 Number of units Sale price per unit Variable costs per unit Calculate: 700 Contribution margin per unit Total contribution margin 903,000 Contribution margin ratio 50% 3520 50,652,800 80% %arrow_forward
arrow_back_ios
SEE MORE QUESTIONS
arrow_forward_ios
Recommended textbooks for you
 Managerial AccountingAccountingISBN:9781337912020Author:Carl Warren, Ph.d. Cma William B. TaylerPublisher:South-Western College PubPrinciples of Accounting Volume 2AccountingISBN:9781947172609Author:OpenStaxPublisher:OpenStax College

Managerial Accounting
Accounting
ISBN:9781337912020
Author:Carl Warren, Ph.d. Cma William B. Tayler
Publisher:South-Western College Pub

Principles of Accounting Volume 2
Accounting
ISBN:9781947172609
Author:OpenStax
Publisher:OpenStax College