
A First Course in Probability (10th Edition)
10th Edition
ISBN: 9780134753119
Author: Sheldon Ross
Publisher: PEARSON
expand_more
expand_more
format_list_bulleted
Related questions
Question
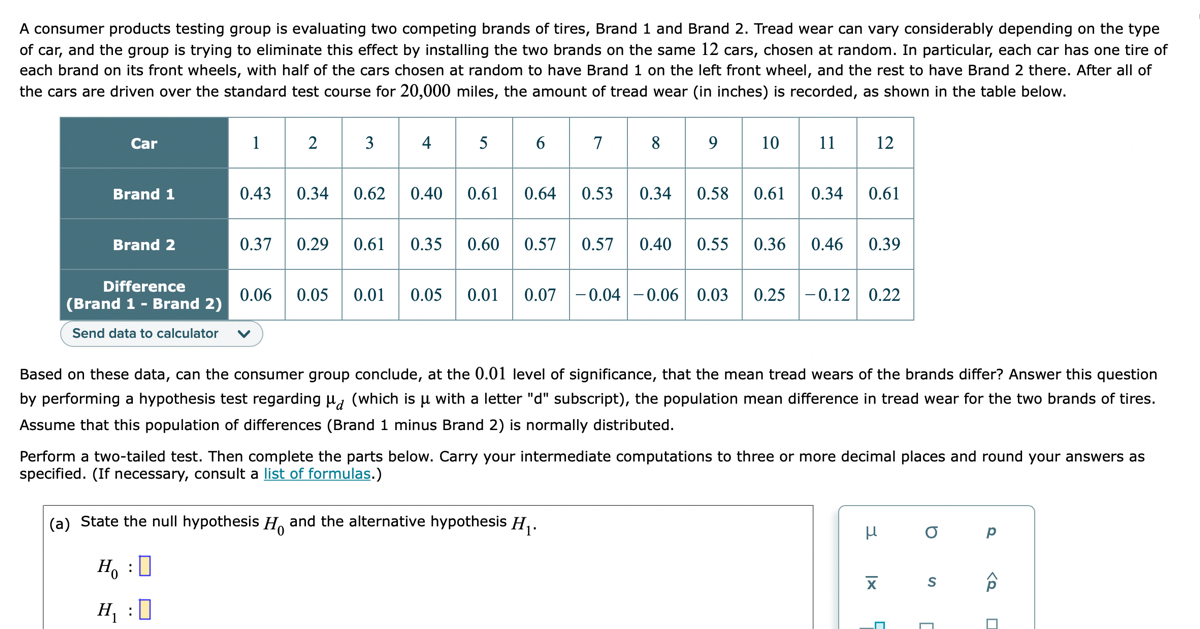

Transcribed Image Text:A consumer products testing group is evaluating two competing brands of tires, Brand 1 and Brand 2. Tread wear can vary considerably depending on the type
of car, and the group is trying to eliminate this effect by installing the two brands on the same 12 cars, chosen at random. In particular, each car has one tire of
each brand on its front wheels, with half of the cars chosen at random to have Brand 1 on the left front wheel, and the rest to have Brand 2 there. After all of
the cars are driven over the standard test course for 20,000 miles, the amount of tread wear (in inches) is recorded, as shown in the table below.
Car
1
3
5
7
10
11
12
Brand 1
0.43
0.34
0.62
0.40
0.61
0.64
0.53
0.34
0.58
0.61
0.34
0.61
Brand 2
0.37
0.29
0.61
0.35
0.60
0.57
0.57
0.40
0.55
0.36
0.46
0.39
Difference
0.06
0.05
0.01
0.05
0.01
0.07
-0.04 -0.06 0.03
0.25
-0.12 0.22
(Brand 1 - Brand 2)
Send data to calculator
Based on these data, can the consumer group conclude, at the 0.01 level of significance, that the mean tread wears of the brands differ? Answer this question
by performing a hypothesis test regarding u, (which is u with a letter "d" subscript), the population mean difference in tread wear for the two brands of tires.
Assume that this population of differences (Brand 1 minus Brand 2) is normally distributed.
Perform a two-tailed test. Then complete the parts below. Carry your intermediate computations to three or more decimal places and round your answers as
specified. (If necessary, consult a list of formulas.)
(a) State the null hypothesis H. and the alternative hypothesis H,.
p
H, :0
H, :0
4-
2.

Transcribed Image Text:Based on these data, can the consumer group conclude, at the 0.01 level of significance, that the mean tread wears of the brands differ? Answer this question
by performing a hypothesis test regarding u, (which is u with a letter "d" subscript), the population mean difference in tread wear for the two brands of tires.
Assume that this population of differences (Brand 1 minus Brand 2) is normally distributed.
Perform a two-tailed test. Then complete the parts below. Carry your intermediate computations to three or more decimal places and round your answers as
specified. (If necessary, consult a list of formulas.)
(a) State the null hypothesis H, and the alternative hypothesis H,.
Ho :0
H, :0
(b) Determine the type of test statistic to use.
Type of test statistic: (Choose one) V
D=0
OSO
(c) Find the value of the test statistic. (Round to three or more decimal places.)
O<O
(d) Find the two critical values at the 0.01 level of significance. (Round to three or more decimal places.)
and|
(e) At the 0.01 level, can the consumer group conclude that the mean tread wears of the brands differ?
Yes
No
olo
Ix
Expert Solution
This question has been solved!
Explore an expertly crafted, step-by-step solution for a thorough understanding of key concepts.

This is a popular solution

Trending nowThis is a popular solution!

Step by stepSolved in 2 steps with 2 images

Knowledge Booster

Similar questions
- Internet Audience At the end of a certain year, the four companies with the largest number of home Internet users in the United States were Microsoft, Time Warner, Yahoo, and Google, with a combined audience of 284 million users. Taking x to be the Microsoft audience in millions, y the Time Warner audience in millions, z the Yahoo audience in millions, and u the Google audience in millions, it was observed that zu = x + y = and xy + zu = 44. How large was the audience of each of the four companies at the end of that year? Microsoft Time Warner Yahoo Google 3(x - y) + 8 50 + z + uarrow_forwardpart 3 4arrow_forwardRivers in North Carolina contain small concentrations of mercury that can accumulate in fish over their lifetimes. The concentration of mercury in fish tissue can be obtained by catching fish and sending samples to a lab for analysis. A study was conducted on fish from the Waccamaw and Lumber Rivers to investigate mercury levels in tissues of largemouth bass. At several stations along each river a group of fish were caught, weighed and measured; in addition a filet from each fish was sent to a lab so that the tissue concentration of mercury could be determined. In all, 171 fish were caught at 15 different research stations along the Waccamaw and Lumber Rivers. Data from fish caught at one of these stations is shown in the followinng table: length weight 1616 47.0 48.7 1862 2855 55.7 45.2 1199 1320 44.7 1225 43.8 870 38.5 1455 45.8 1220 44.0 1033 40.4 Compute the correlation between length and weight for these fish. (Assume the correlation conditions have been satisfied and round your…arrow_forward
- This is a practice exam. I would like to know how to slove usign excel or megastat Wenton Powersports produces dune buggies. They have three assembly lines, “Razor,” “Blazer,” and “Tracer,” named after the particular dune buggy models produced on those lines. Each assembly line was originally designed using the same target production rate. However, over the years, various changes have been made to the lines. Accordingly, management wishes to determine whether the assembly lines are still operating at the same average hourly production rate. Production data (in dune buggies/hour) for the last eight hours are as follows. (You may find it useful to reference the F table.) Razor Blazer Tracer 11 10 9 10 8 9 8 11 10 10 9 9 9 11 8 9 10 7 12 11 8 12 8 9 Click here for the Excel Data File a. Specify the competing hypotheses to…arrow_forwardThe Instant Paper Clip Office Supply Company sells and delivers office supplies to companies, schools, and agencies within a 50-mile radius of its warehouse. The office supply business is competitive, and the ability to deliver orders promptly is a big factor in getting new customers and maintaining old ones. (Offices typically order not when they run low on supplies, but when they completely run out. As a result, they need their orders immediately.) The manager of the company wants to be certain that enough drivers and vehicles are available to deliver orders promptly and that they have adequate inventory in stock. Therefore, the manager wants to be able to forecast the demand for deliveries during the next month. From the records of previous orders, management has accumulated the following data for the past 10 months: Month Jan. Feb. Mar. Apr. May Jun. Jul. Aug. Sep. Oct. Orders 145 70 115 85 120 54 82 141 123 94 Compute the mean…arrow_forwardIn the city of AZ, there are two supermarkets, X-Mart and Y-Mart. It is assumed that every shopper makes a purchase once a week at one of these supermarkets (not both).In a study, 100 samples of shoppers were taken over 10 weeks. From the study, it is known that if a shopper goes to X-Mart in one week, 85 people will continue to shop at X-Mart in the following week, and if a shopper goes to Y-Mart in one week, 70 people will continue to shop at Y-Mart in the following week.Create a transition probability table and matrix for this scenario, and then If in the first week Ivankov buys from X-Mart, what is the probability that Terry will buy from X-Mart in the third and fourth weeks?arrow_forward
- Cholesterol Testing. A large health care organization uses three laboratories for the routine analysis of blood samples. It is important that the three labs provide equivalent test results. To check that, blood samples are obtained from 10 randomly selected individuals; each blood sample is then divided into three blood subsamples of equal volume; and then the three blood subsamples from each person are sent to different labs. For this problem, the analysis is confined to assessing the measurement of the total cholesterol level for a person. The data are in the following table.arrow_forwardA national restaurant chain is composed of 6500 restaurants, each of which is located in close proximity to an interstate highway. The restaurant's business strategy is to serve its core customer base: people travelling on the interstate highway system who are looking for a quality dining experience. Customers generally enjoy the restaurant chain's menu, atmosphere, and consistency from restaurant to restaurant. The company's leadership, located at corporate headquarters, is very interested in the relationship between the cost of a gallon of gasoline and the company's revenue. Specifically, the company is concerned that if gasoline prices rise in the near future, the company's revenue will decline dramatically. The company's research department recently collected data for analysis in order to support leadership's upcoming discussion of whether the company should expand and diversify to locations away from an interstate highway. Annual revenue figures from a random sample…arrow_forwardEach box of Healthy Crunch breakfast cereal contains a coupon entitling you to afree package of garden seeds. At the Healthy Crunch home office, they use the weightof incoming mail to determine how many of their employees are to be assigned tocollecting coupons and mailing out seed packages on a given day. (Healthy Crunch hasa policy of answering all its mail on the day it is received.)Let x = weight of incoming mail and y = number of employees required to process themail in one working day. A random sample of 8 days gave the following data:x (lb) 11 20 16 6 12 18 23 25y (Number of employees) 6 10 9 5 8 14 13 16a.) Draw a scatter diagram for the datab.) Find the equation of the least-squares line. Plot the line on the scatter diagram forpart (a).c.) Find the sample correlation coefficient r and the coefficient of determination ??.d.) If Healthy Crunch receives 15 pounds of mail, how many employees should beassigned mail duty that day? Show workarrow_forward
arrow_back_ios
arrow_forward_ios
Recommended textbooks for you
- A First Course in Probability (10th Edition)ProbabilityISBN:9780134753119Author:Sheldon RossPublisher:PEARSON

A First Course in Probability (10th Edition)
Probability
ISBN:9780134753119
Author:Sheldon Ross
Publisher:PEARSON