MATLAB: An Introduction with Applications
6th Edition
ISBN: 9781119256830
Author: Amos Gilat
Publisher: John Wiley & Sons Inc
expand_more
expand_more
format_list_bulleted
Question
Solve all

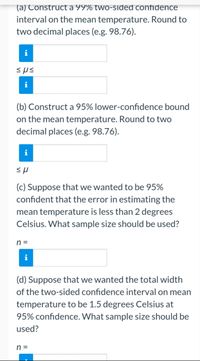
Transcribed Image Text:(a) Construct a 99% two-sided confidence
interval on the mean temperature. Round to
two decimal places (e.g. 98.76).
i
sus
(b) Construct a 95% lower-confidence bound
on the mean temperature. Round to two
decimal places (e.g. 98.76).
i
εμ
(c) Suppose that we wanted to be 95%
confident that the error in estimating the
mean temperature is less than 2 degrees
Celsius. What sample size should be used?
n =
(d) Suppose that we wanted the total width
of the two-sided confidence interval on mean
temperature to be 1.5 degrees Celsius at
95% confidence. What sample size should be
used?
n=
![Please use the accompanying Excel data set
or accompanying Text file data set when
completing the following exercise.
An article in the Journal of Agricultural Science
["The Use of Residual Maximum Likelihood
to Model Grain Quality Characteristics of
Wheat with Variety, Climatic and Nitrogen
Fertilizer Effects" (1997, Vol. 128, pp. 135-
142)] investigated means of wheat grain
crude protein content (CP) and Hagberg
falling number (HFN) surveyed in the UK.
The analysis used a variety of nitrogen
fertilizer applications (kg N/ha), temperature
(°C), and total monthly rainfall (mm). The
data shown below describe temperatures for
wheat grown at Harper Adams Agricultural
College between 1982 and 1993. The
temperatures measured in June were
obtained as follows:
14.1 13.7 12.2 12.3 14.8 14.7
16.0 13.8 12.9 12.6 14.8
Assume that the population has a normal
distribution and the standard deviation is
known to be o = 0.6.
(a) Construct a 99% two-sided confidence
interval on the mean temperature. Round to](https://content.bartleby.com/qna-images/question/488bc797-3392-41c5-bbd1-e6cdce65635c/0f76a1a8-55f9-4f45-9f6f-bb55847bc1c1/r24ms4s_thumbnail.jpeg)
Transcribed Image Text:Please use the accompanying Excel data set
or accompanying Text file data set when
completing the following exercise.
An article in the Journal of Agricultural Science
["The Use of Residual Maximum Likelihood
to Model Grain Quality Characteristics of
Wheat with Variety, Climatic and Nitrogen
Fertilizer Effects" (1997, Vol. 128, pp. 135-
142)] investigated means of wheat grain
crude protein content (CP) and Hagberg
falling number (HFN) surveyed in the UK.
The analysis used a variety of nitrogen
fertilizer applications (kg N/ha), temperature
(°C), and total monthly rainfall (mm). The
data shown below describe temperatures for
wheat grown at Harper Adams Agricultural
College between 1982 and 1993. The
temperatures measured in June were
obtained as follows:
14.1 13.7 12.2 12.3 14.8 14.7
16.0 13.8 12.9 12.6 14.8
Assume that the population has a normal
distribution and the standard deviation is
known to be o = 0.6.
(a) Construct a 99% two-sided confidence
interval on the mean temperature. Round to
Expert Solution
This question has been solved!
Explore an expertly crafted, step-by-step solution for a thorough understanding of key concepts.
This is a popular solution
Trending nowThis is a popular solution!
Step by stepSolved in 2 steps with 2 images

Knowledge Booster
Similar questions
Recommended textbooks for you
 MATLAB: An Introduction with ApplicationsStatisticsISBN:9781119256830Author:Amos GilatPublisher:John Wiley & Sons Inc
 Probability and Statistics for Engineering and th...StatisticsISBN:9781305251809Author:Jay L. DevorePublisher:Cengage Learning
 Statistics for The Behavioral Sciences (MindTap C...StatisticsISBN:9781305504912Author:Frederick J Gravetter, Larry B. WallnauPublisher:Cengage Learning
 Elementary Statistics: Picturing the World (7th E...StatisticsISBN:9780134683416Author:Ron Larson, Betsy FarberPublisher:PEARSON
 The Basic Practice of StatisticsStatisticsISBN:9781319042578Author:David S. Moore, William I. Notz, Michael A. FlignerPublisher:W. H. Freeman
 Introduction to the Practice of StatisticsStatisticsISBN:9781319013387Author:David S. Moore, George P. McCabe, Bruce A. CraigPublisher:W. H. Freeman

MATLAB: An Introduction with Applications
Statistics
ISBN:9781119256830
Author:Amos Gilat
Publisher:John Wiley & Sons Inc

Probability and Statistics for Engineering and th...
Statistics
ISBN:9781305251809
Author:Jay L. Devore
Publisher:Cengage Learning

Statistics for The Behavioral Sciences (MindTap C...
Statistics
ISBN:9781305504912
Author:Frederick J Gravetter, Larry B. Wallnau
Publisher:Cengage Learning

Elementary Statistics: Picturing the World (7th E...
Statistics
ISBN:9780134683416
Author:Ron Larson, Betsy Farber
Publisher:PEARSON

The Basic Practice of Statistics
Statistics
ISBN:9781319042578
Author:David S. Moore, William I. Notz, Michael A. Fligner
Publisher:W. H. Freeman

Introduction to the Practice of Statistics
Statistics
ISBN:9781319013387
Author:David S. Moore, George P. McCabe, Bruce A. Craig
Publisher:W. H. Freeman