MATLAB: An Introduction with Applications
6th Edition
ISBN: 9781119256830
Author: Amos Gilat
Publisher: John Wiley & Sons Inc
expand_more
expand_more
format_list_bulleted
Question
Please see below. I need help with the two red boxes as my answers came back wrong. Note that the test statistics IS NOT 0.5357

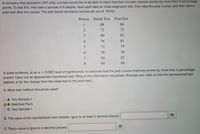
Transcribed Image Text:A company that sponsors LSAT prep courses would like to be able to claim that their courses improve scores by more than 3 percentage
points. To test this, they take a sample of 8 people, have each take an initial diagnostic test, then take the prep course, and then take a
post-test after the course. The test results are below (scores are out of 100%):
Person
Initial Test
Post-Test
1
68
66
72
73
3
60
62
4
76
81
73
79
6.
70
76
7
69
82
8.
68
68
Is there evidence, at an a = 0.065 level of significance, to conclude that the prep course improves scores by more than 3 percentage
points? Carry out an appropriate hypothesis test, filling in the information requested. (Arrange your data so that the standardized test
statistic is for the change from the initial test to the post-test.)
A. What test method should be used?
OA. Two Sample z
O B. Matched Pairs
OC. Two Sample t
B. The value of the standardized test statistic: (give to at least 3 decimal places)
C. The p-value is (give to 4 decimal places)
Expert Solution
This question has been solved!
Explore an expertly crafted, step-by-step solution for a thorough understanding of key concepts.
This is a popular solution
Trending nowThis is a popular solution!
Step by stepSolved in 6 steps

Knowledge Booster
Similar questions
- Find the SLG Percentage for Mr Hodowith 52 doubles, 31 singles, 2 triples, 61homeruns, and 335 at bats.arrow_forwardFind P₄₁ , which is the score separating the bottom 41% from the top 59%.P₄₁ =Enter your answer as a number accurate to 1 decimal place. Answers obtained using exact z-scores or z-scores rounded to 3 decimal places are accepted.arrow_forwardA survey of 500 citizens of a large country revealed that 70 of them believe the government's highest priority should be foreign relations. Find the standard error for the sample proportion of citizens in the country who believe the government's highest priority should be foreign relations. Enter your answer as a decimal rounded to three decimal places.arrow_forward
- What is the percentage of students weighing less than or equal too 203 poundsarrow_forwardThe American Heart Association is about to conduct an anti-smoking campaign and wants to know the fraction of Americans over 33 who smoke. step 1 of 2: suppose a sample of 1267 Americans over 33 is drawn. Of these people, 913 don't smoke. Using the data, estimate the proportion of Americans over 33 who smoke. Enter your answer as a decimal number rounded to three decimal places.arrow_forwardProfessor X gave a quiz to five students. He remembered four of the grades 82, 88, 81, 77 and the mean 80. What was the other grade?arrow_forward
- The mean of 14 numbers in a data set is 43. A new number is included in the data set. It changes the mean to 44. What is the new number? Record the result below accurate to two decimal places.arrow_forwardProf. Leen wants to estimate the more than 92% percent of adults living in a large city have cell phones. Prof. Leen randomly selects 160 adult residents to determine whether they have cell phones. Of the 160 people sampled, 155 own cell phones. Find the p-value for the test. (Round the answer to three decimal places.)arrow_forwardHere are some of the Final Exam scores from last semester's class: 81, 77, 90, 93, 99, 88, 85, 70, 79, 91, 94, 87. Find the mean. Round your answer to 3 decimal places.arrow_forward
arrow_back_ios
SEE MORE QUESTIONS
arrow_forward_ios
Recommended textbooks for you
 MATLAB: An Introduction with ApplicationsStatisticsISBN:9781119256830Author:Amos GilatPublisher:John Wiley & Sons Inc
 Probability and Statistics for Engineering and th...StatisticsISBN:9781305251809Author:Jay L. DevorePublisher:Cengage Learning
 Statistics for The Behavioral Sciences (MindTap C...StatisticsISBN:9781305504912Author:Frederick J Gravetter, Larry B. WallnauPublisher:Cengage Learning
 Elementary Statistics: Picturing the World (7th E...StatisticsISBN:9780134683416Author:Ron Larson, Betsy FarberPublisher:PEARSON
 The Basic Practice of StatisticsStatisticsISBN:9781319042578Author:David S. Moore, William I. Notz, Michael A. FlignerPublisher:W. H. Freeman
 Introduction to the Practice of StatisticsStatisticsISBN:9781319013387Author:David S. Moore, George P. McCabe, Bruce A. CraigPublisher:W. H. Freeman

MATLAB: An Introduction with Applications
Statistics
ISBN:9781119256830
Author:Amos Gilat
Publisher:John Wiley & Sons Inc

Probability and Statistics for Engineering and th...
Statistics
ISBN:9781305251809
Author:Jay L. Devore
Publisher:Cengage Learning

Statistics for The Behavioral Sciences (MindTap C...
Statistics
ISBN:9781305504912
Author:Frederick J Gravetter, Larry B. Wallnau
Publisher:Cengage Learning

Elementary Statistics: Picturing the World (7th E...
Statistics
ISBN:9780134683416
Author:Ron Larson, Betsy Farber
Publisher:PEARSON

The Basic Practice of Statistics
Statistics
ISBN:9781319042578
Author:David S. Moore, William I. Notz, Michael A. Fligner
Publisher:W. H. Freeman

Introduction to the Practice of Statistics
Statistics
ISBN:9781319013387
Author:David S. Moore, George P. McCabe, Bruce A. Craig
Publisher:W. H. Freeman