MATLAB: An Introduction with Applications
6th Edition
ISBN: 9781119256830
Author: Amos Gilat
Publisher: John Wiley & Sons Inc
expand_more
expand_more
format_list_bulleted
Question

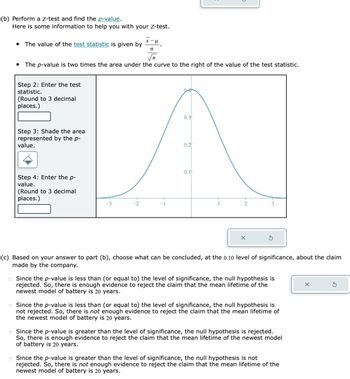
Transcribed Image Text:(b) Perform a Z-test and find the p-value.
Here is some information to help you with your Z-test.
• The value of the test statistic is given by
• The p-value is two times the area under the curve to the right of the value of the test statistic.
Step 2: Enter the test
statistic.
(Round to 3 decimal
places.)
Step 3: Shade the area
represented by the p-
value.
Step 4: Enter the p-
value.
(Round to 3 decimal
places.)
0.3
0.2
0.1
(c) Based on your answer to part (b), choose what can be concluded, at the 0.10 level of significance, about the claim
made by the company.
Since the p-value is less than (or equal to) the level of significance, the null hypothesis is
rejected. So, there is enough evidence to reject the claim that the mean lifetime of the
newest model of battery is 20 years.
o Since the p-value is less than (or equal to) the level of significance, the null hypothesis is
not rejected. So, there is not enough evidence to reject the claim that the mean lifetime of
the newest model of battery is 20 years.
Since the p-value is greater than the level of significance, the null hypothesis is rejected.
So, there is enough evidence to reject the claim that the mean lifetime of the newest model
of battery is 20 years.
Since the p-value is greater than the level of significance, the null hypothesis is not
rejected. So, there is not enough evidence to reject the claim that the mean lifetime of the
newest model of battery is 20 years.

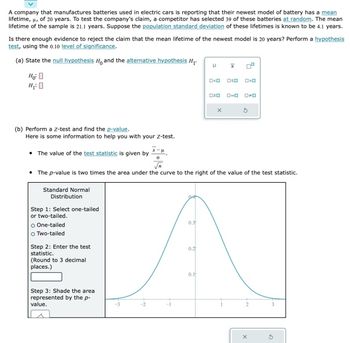
Transcribed Image Text:A company that manufactures batteries used in electric cars is reporting that their newest model of battery has a mean
lifetime, μ, of 20 years. To test the company's claim, a competitor has selected 39 of these batteries at random. The mean
lifetime of the sample is 21.1 years. Suppose the population standard deviation of these lifetimes is known to be 4.1 years.
Is there enough evidence to reject the claim that the mean lifetime of the newest model is 20 years? Perform a hypothesis
test, using the 0.10 level of significance.
(a) State the null hypothesis H, and the alternative hypothesis H₁.
Ho
H₂O
(b) Perform a z-test and find the p-value.
Here is some information to help you with your Z-test.
Standard Normal
Distribution
Step 1: Select one-tailed
or two-tailed.
O One-tailed
○ Two-tailed
Step 2: Enter the test
statistic.
(Round to 3 decimal
places.)
Step 3: Shade the area
represented by the p-
value.
• The value of the test statistic is given by *-.
√
The p-value is two times the area under the curve to the right of the value of the test statistic.
0.3
0.2
H x
0.1
O<0 oso
0>0
020 0-0 0-0
X
G
X
Expert Solution
This question has been solved!
Explore an expertly crafted, step-by-step solution for a thorough understanding of key concepts.
This is a popular solution
Trending nowThis is a popular solution!
Step by stepSolved in 4 steps with 1 images

Knowledge Booster
Similar questions
- A company that runs a chain of quick oil change centers, tries to attract customers by claiming that it completes oil changes faster than its competition. So it periodically estimates the time taken to do oil changes at its centers. From historical records, the company knows that the population standard deviation of oil change duration is 15 minutes. Recently, 40 customers were asked how much time they spent getting an oil change at one of their centers. Based on the sample data, the chain concluded that the average oil change time for the population of all its customers was between 15 and 25 minutes. What was the confidence level at which the inference was made?arrow_forwardA shipping firm suspects that the mean life of a certain brand of tire used by its trucks is lessthan 38,500 miles. To check the claim, the firm randomly selects and tests 28 of these tires and gets a mean lifetime of 37,550 miles with a standard deviation of 1250 miles. At α = 0.02, test the shipping firm's claim. Round the test statistic to the nearest thousandth.arrow_forwardI need help with this problem.arrow_forward
- An engineer working for a tire manufacturer investigates the average life of a new material to be used in the manufacturing process. For this purpose, he builds a sample of 13 tires and tests them in a laboratory until the end of their useful life is reached. The data obtained from the sample are as follows: average of 60897.9 km and standard deviation of 2734.8 km. The engineer would like to demonstrate that the average service life of the tire with the new material exceeds 60,000 km. a) State the null and alternative hypothesis to be stated in this experiment. Test the stated hypotheses using an α = 0.05 What conclusions are reached? b) Find a 95% confidence interval for the average tire life with the new material. Interpret your answer. (RESPOND MANUALLY) (RESPOND MANUALLY)arrow_forwardA chain of restaurants has historically had a mean wait time of 5 minutes for its customers. Recently, the restaurant added several very popular dishes back to their menu. Due to this, the manager suspects the wait time, μ, has increased. He takes a random sample of 35 customers. The mean wait time for the sample is 5.1 minutes. Assume the population standard deviation for the wait times is known to be 1.1 minutes. Can the manager conclude that the mean wait time is now greater than 5 minutes? Perform a hypothesis test, using the 0.10 level of significance. (a) State the null hypothesis Ho and the alternative hypothesis H₁. Ho: O H₁:0 μ X 0° OO 20ם ローロ OO × 5 (b) Perform a hypothesis test. The test statistic has a normal distribution (so the test is a "Z-test"). Here is some other information to help you with your test. 0.10 is the value that cuts off an area of 0.10 in the right tail. *-μ ⚫ The test statistic has a normal distribution and the value is given by z=- σ √n Standard Normal…arrow_forwardA manufacturer of TV tubes has for many years used a process giving a meantube life of 4700 hours and a standard deviation of 1460 hours. A new process is tried to see if it will increase the life significantly. A sample of 100new tubes gave a mean life of 5000 hours. Is the new process better than the old one at a 1% level of significance?arrow_forward
- The length of students' college careers at Anytown University is known to be normally distributed, with a mean length of 5.5 years and a standard deviation of 1.75 years. What is the lower quartile for the length of students' careers at Anytown University?arrow_forwardAn article in the National Geographic News ("U.S. Racking Up Huge Sleep Debt." February 24, 2005) argues that Americans are increasingly skimping on their sleep A researcher in a small Midwestern town wants to estimate the mean weekday sleep time of its adult residents. He takes a random sample of 80 adult residents and records their weekday mean sleep time as 6.4 hours. Assume that the population standard deviation is fairly stable at 1.8 hours. [You may find it useful to reference the z table.) a. Calculate the 95% confidence interval for the population mean weekday sleep time of all adult residents of this Midwestem town (Round intermediote calculations to at least 4 decimal places. Round "z" volue to 2 decimol places and final answers to 2 decimal places.) Confidence interval to b. Can we conclude with 95% contfidence that the mean sleep time of all adult residents in this midwestern town is not 7 hours? O Yes, since the confidence interval contains the value 7 O Yes, since the…arrow_forwardThe manufacturer of a particular brand of tires claims they average at least 50,000 miles before needing to be replaced. From past studies of this tire, it is known that the population standard deviation is 8,000 miles. A survey of tire owners was conducted. From the 21 tires surveyed, the mean lifespan was 41500 miles. Using alpha = 0.05, can we prove that the data in inconsistent with the manufacturers claim? What is the Test Statisticarrow_forward
- The physical plant at the main campus of a large state university recieves daily requests to replace florecent lightbulbs. The distribution of the number of daily requests is bell-shaped and has a mean of 62 and a standard deviation of 4. Using the empirical rule (as presented in the book), what is the approximate percentage of lightbulb replacement requests numbering between 58 and 62?ans = %arrow_forwardA manufacturer knows that their items have a normally distributed lifespan, with a mean of 6.9 years, and standard deviation of 1.6 years.The 2% of items with the shortest lifespan will last less than how many years?arrow_forward
arrow_back_ios
arrow_forward_ios
Recommended textbooks for you
 MATLAB: An Introduction with ApplicationsStatisticsISBN:9781119256830Author:Amos GilatPublisher:John Wiley & Sons Inc
 Probability and Statistics for Engineering and th...StatisticsISBN:9781305251809Author:Jay L. DevorePublisher:Cengage Learning
 Statistics for The Behavioral Sciences (MindTap C...StatisticsISBN:9781305504912Author:Frederick J Gravetter, Larry B. WallnauPublisher:Cengage Learning
 Elementary Statistics: Picturing the World (7th E...StatisticsISBN:9780134683416Author:Ron Larson, Betsy FarberPublisher:PEARSON
 The Basic Practice of StatisticsStatisticsISBN:9781319042578Author:David S. Moore, William I. Notz, Michael A. FlignerPublisher:W. H. Freeman
 Introduction to the Practice of StatisticsStatisticsISBN:9781319013387Author:David S. Moore, George P. McCabe, Bruce A. CraigPublisher:W. H. Freeman

MATLAB: An Introduction with Applications
Statistics
ISBN:9781119256830
Author:Amos Gilat
Publisher:John Wiley & Sons Inc

Probability and Statistics for Engineering and th...
Statistics
ISBN:9781305251809
Author:Jay L. Devore
Publisher:Cengage Learning

Statistics for The Behavioral Sciences (MindTap C...
Statistics
ISBN:9781305504912
Author:Frederick J Gravetter, Larry B. Wallnau
Publisher:Cengage Learning

Elementary Statistics: Picturing the World (7th E...
Statistics
ISBN:9780134683416
Author:Ron Larson, Betsy Farber
Publisher:PEARSON

The Basic Practice of Statistics
Statistics
ISBN:9781319042578
Author:David S. Moore, William I. Notz, Michael A. Fligner
Publisher:W. H. Freeman

Introduction to the Practice of Statistics
Statistics
ISBN:9781319013387
Author:David S. Moore, George P. McCabe, Bruce A. Craig
Publisher:W. H. Freeman