
MATLAB: An Introduction with Applications
6th Edition
ISBN: 9781119256830
Author: Amos Gilat
Publisher: John Wiley & Sons Inc
expand_more
expand_more
format_list_bulleted
Related questions
Question
Plz help asap t5
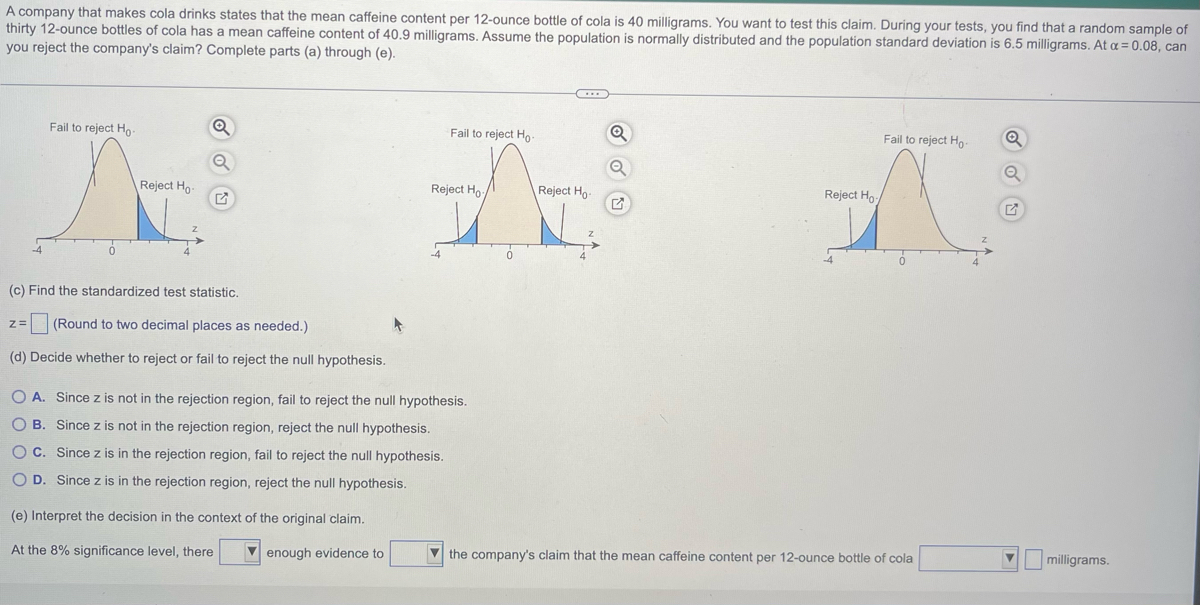

Transcribed Image Text:A company that makes cola drinks states that the mean caffeine content per 12-ounce bottle of cola is 40 milligrams. You want to test this claim. During your tests, you find that a random sample of
thirty 12-ounce bottles of cola has a mean caffeine content of 40.9 milligrams. Assume the population is normally distributed and the population standard deviation is 6.5 milligrams. At α = 0.08, can
you reject the company's claim? Complete parts (a) through (e).
Fail to reject Ho-
Reject Ho
Z=
Q
Q
(c) Find the standardized test statistic.
(Round to two decimal places as needed.)
(d) Decide whether to reject or fail to reject the null hypothesis.
(...)
Fail to reject Ho- Q
Fail to reject Ho
Reject Ho
A A
Reject Ho
Reject Ho
O A. Since z is not in the rejection region, fail to reject the null hypothesis.
OB. Since z is not in the rejection region, reject the null hypothesis.
OC. Since z is in the rejection region, fail to reject the null hypothesis.
O D. Since z is in the rejection region, reject the null hypothesis.
(e) Interpret the decision in the context of the original claim.
At the 8% significance level, there
enough evidence to
the company's claim that the mean caffeine content per 12-ounce bottle of cola
Q
milligrams.

Transcribed Image Text:A company that makes cola drinks states that the mean caffeine content per 12-ounce bottle of cola is 40 milligrams. You want to test this claim. During your tests, you find that a random sample of
thirty 12-ounce bottles of cola has a mean caffeine content of 40.9 milligrams. Assume the population is normally distributed and the population standard deviation is 6.5 milligrams. At a = 0.08, can
you reject the company's claim? Complete parts (a) through (e).
(a) Identify Ho and H₂. Choose the correct answer below.
OA. Ho: μ#40.9
H₂: H=40.9
OC. Ho: μ#40
Ha: H=40
O E. Ho: 240.9
Ha: H<40.9
Identify the rejection region(s). Choose the correct answer below.
O A.
Fail to reject Ho-
Q
Q
(b) Find the critical value(). Select the correct choice below and fill in the answer box within your choice.
(Round to two decimal places as needed.)
OA. The critical values are +
OB. The critical value is
OB.
(...)
Fail to reject Ho
OB. Ho: μ=40
H₂:μ#40
O D. Ho: 240
Ha: <40
OF. Ho: H=40.9
Ha: μ#40.9
Q
Q
O C.
Fail to reject Ho
Q
Q
Expert Solution
This question has been solved!
Explore an expertly crafted, step-by-step solution for a thorough understanding of key concepts.

This is a popular solution

Trending nowThis is a popular solution!

Step by stepSolved in 7 steps with 4 images

Knowledge Booster

Similar questions
Recommended textbooks for you
- MATLAB: An Introduction with ApplicationsStatisticsISBN:9781119256830Author:Amos GilatPublisher:John Wiley & Sons Inc
 Probability and Statistics for Engineering and th...StatisticsISBN:9781305251809Author:Jay L. DevorePublisher:Cengage Learning
 Statistics for The Behavioral Sciences (MindTap C...StatisticsISBN:9781305504912Author:Frederick J Gravetter, Larry B. WallnauPublisher:Cengage Learning
  Elementary Statistics: Picturing the World (7th E...StatisticsISBN:9780134683416Author:Ron Larson, Betsy FarberPublisher:PEARSON
 The Basic Practice of StatisticsStatisticsISBN:9781319042578Author:David S. Moore, William I. Notz, Michael A. FlignerPublisher:W. H. Freeman
 Introduction to the Practice of StatisticsStatisticsISBN:9781319013387Author:David S. Moore, George P. McCabe, Bruce A. CraigPublisher:W. H. Freeman
MATLAB: An Introduction with Applications
Statistics
ISBN:9781119256830
Author:Amos Gilat
Publisher:John Wiley & Sons Inc
Probability and Statistics for Engineering and th...
Statistics
ISBN:9781305251809
Author:Jay L. Devore
Publisher:Cengage Learning
Statistics for The Behavioral Sciences (MindTap C...
Statistics
ISBN:9781305504912
Author:Frederick J Gravetter, Larry B. Wallnau
Publisher:Cengage Learning
Elementary Statistics: Picturing the World (7th E...
Statistics
ISBN:9780134683416
Author:Ron Larson, Betsy Farber
Publisher:PEARSON
The Basic Practice of Statistics
Statistics
ISBN:9781319042578
Author:David S. Moore, William I. Notz, Michael A. Fligner
Publisher:W. H. Freeman
Introduction to the Practice of Statistics
Statistics
ISBN:9781319013387
Author:David S. Moore, George P. McCabe, Bruce A. Craig
Publisher:W. H. Freeman