FINANCIAL ACCOUNTING
10th Edition
ISBN: 9781259964947
Author: Libby
Publisher: MCG
expand_more
expand_more
format_list_bulleted
infoPractice Pack
Question
infoPractice Pack

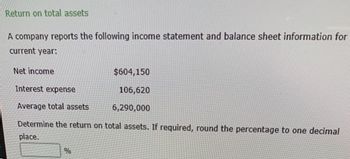
Transcribed Image Text:Return on total assets
A company reports the following income statement and balance sheet information for
current year:
Net income
$604,150
Interest expense
106,620
Average total assets
6,290,000
Determine the return on total assets. If required, round the percentage to one decimal
place.
%
Expert Solution
This question has been solved!
Explore an expertly crafted, step-by-step solution for a thorough understanding of key concepts.
Includes step-by-step video
Learn your wayIncludes step-by-step video
Step by stepSolved in 2 steps

Knowledge Booster
Learn more about
Need a deep-dive on the concept behind this application? Look no further. Learn more about this topic, accounting and related others by exploring similar questions and additional content below.Similar questions
- Assume the following sales data for a company:Current year$832,402 Preceding year608,082What is the percentage increase in sales from the preceding year to the current year? a.136.89% b.36.89% c.73.05% d.26.95% The relationship of $242,729 to $104,267, expressed as a ratio, is a.0.8 b.2.3 c.0.4 d.0.7arrow_forwardBenson Company’s net income was $225,000 for Year 1, $243,750 for Year 2, and $293,160 for Year 3. Assume trend percentages for net income over the three-year period are computed, with Year 1 serving as the base year.The trend percentage for Year 3’s net income is: Select one: A. 117.30% B. 86.36% C. 120.92% D. 130.29%arrow_forwardReturn on total assets A company reports the following income statement and balance sheet information for the current year: Net income $364,680 Interest expense 64,350 Average total assets 6,810,000 Determine the return on total assets. If required, round the percentage to one decimal place.arrow_forward
- Refer to the following selected financial information from a company. Compute the company’s return on total assets for Year 2. Year 2 Year 1 Net sales $ 483,000 $ 427,150 Cost of goods sold 277,200 251,020 Interest expense 10,600 11,600 Net income before tax 68,150 53,580 Net income after tax 46,950 40,800 Total assets 318,900 293,400 Total liabilities 176,900 168,200 Total equity 142,000 125,200 Answer: A. 22.3% B. 14.7% C. 9.7% D. 2.7% E. 15.3%arrow_forwardCompute common-size percents for the following comparative income statements (round percents to one decimal). Using the common-size percents, which item is most responsible for the decline in net income?arrow_forwardGiven the following ratios, how well has the company been managing its liquidity for the past two years? Current Year Past Year Ratio Company Industry Company Industry Current ratio 1.9 2.5 1.1 2.3 Quick ratio 0.7 1.0 0.4 0.9 Number of days of receivables 39.0 34.0 44.0 32.5 Number of days of inventory 41.0 30.3 45.0 27.4 Number of days of payables 34.3 36.0 29.4 35.5arrow_forward
- A company reports the following amounts at the end of the year: Sales revenue Cost of goods sold Net income $ 310,000 210,000 53,000 Compute the company's gross profit ratio. (Round your final answe Gross profit ratio %arrow_forwardFollowing information are taken from financial statements of a company. What is the interest coverage ratio? Sales Revenue $1,000,000 Tax Rate 20% Net Income $200,000 Operating Income $280,000arrow_forwardAssume the following sales data for a company: Current year $778,795 Preceding year 600,257 What is the percentage increase in sales from the preceding year to the current year?arrow_forward
- Return on Assets Ratio and Asset Turnover Ratio Northern Systems reported the following financial data (in millions) in its annual report: Previous Year Current Year Net Income $9,050 $7,500 Net Sales 52,350 37,200 Total Assets 58,734 68,128 If the company’s total assets are $55,676 at the beginning of the previous year, calculate the company’s: (a) return on assets (round answers to one decimal place - ex: 10.7%) (b) asset turnover for both years (round answers to two decimal places) Previous Year Current Year a. Return on Assets Ratio Answer Answer b. Asset Turnover Ratio Answer Answerarrow_forwardSelected data from Decco Company are presented below: Total assets $1,600,000 Average assets 2,000,000 Net income 380,000 Net sales 1,500,000 Average common stockholders' equity 1,000,000 Instructions Calculate the following profitability ratios from the above information. 1. Profit margin. 2. Asset turnover. 3. Return on assets.arrow_forwardAcountarrow_forward
arrow_back_ios
SEE MORE QUESTIONS
arrow_forward_ios
Recommended textbooks for you

 AccountingAccountingISBN:9781337272094Author:WARREN, Carl S., Reeve, James M., Duchac, Jonathan E.Publisher:Cengage Learning,
 Accounting Information SystemsAccountingISBN:9781337619202Author:Hall, James A.Publisher:Cengage Learning,
 Horngren's Cost Accounting: A Managerial Emphasis...AccountingISBN:9780134475585Author:Srikant M. Datar, Madhav V. RajanPublisher:PEARSON
 Intermediate AccountingAccountingISBN:9781259722660Author:J. David Spiceland, Mark W. Nelson, Wayne M ThomasPublisher:McGraw-Hill Education
 Financial and Managerial AccountingAccountingISBN:9781259726705Author:John J Wild, Ken W. Shaw, Barbara Chiappetta Fundamental Accounting PrinciplesPublisher:McGraw-Hill Education


Accounting
Accounting
ISBN:9781337272094
Author:WARREN, Carl S., Reeve, James M., Duchac, Jonathan E.
Publisher:Cengage Learning,

Accounting Information Systems
Accounting
ISBN:9781337619202
Author:Hall, James A.
Publisher:Cengage Learning,

Horngren's Cost Accounting: A Managerial Emphasis...
Accounting
ISBN:9780134475585
Author:Srikant M. Datar, Madhav V. Rajan
Publisher:PEARSON

Intermediate Accounting
Accounting
ISBN:9781259722660
Author:J. David Spiceland, Mark W. Nelson, Wayne M Thomas
Publisher:McGraw-Hill Education

Financial and Managerial Accounting
Accounting
ISBN:9781259726705
Author:John J Wild, Ken W. Shaw, Barbara Chiappetta Fundamental Accounting Principles
Publisher:McGraw-Hill Education