Advanced Engineering Mathematics
10th Edition
ISBN: 9780470458365
Author: Erwin Kreyszig
Publisher: Wiley, John & Sons, Incorporated
expand_more
expand_more
format_list_bulleted
Question

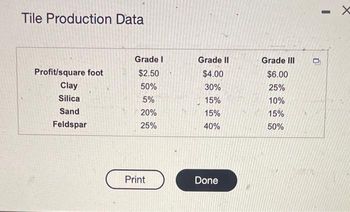
Transcribed Image Text:Tile Production Data
Profit/square foot
Clay
Silica
Sand
Feldspar
Grade I
$2.50
50%
5%
20%
25%
Print
Grade II
$4.00
30%
15%
15%
40%
Done
Grade Ill
$6.00
25%
10%
15%
50%
0
-

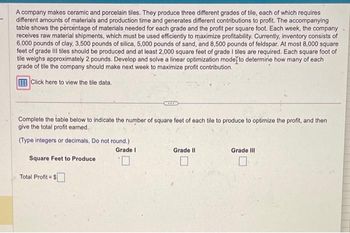
Transcribed Image Text:A company makes ceramic and porcelain tiles. They produce three different grades of tile, each of which requires
different amounts of materials and production time and generates different contributions to profit. The accompanying
table shows the percentage of materials needed for each grade and the profit per square foot. Each week, the company
receives raw material shipments, which must be used efficiently to maximize profitability. Currently, inventory consists of
6,000 pounds of clay, 3,500 pounds of silica, 5,000 pounds of sand, and 8,500 pounds of feldspar. At most 8,000 square
feet of grade III tiles should be produced and at least 2,000 square feet of grade I tiles are required. Each square foot of
tile weighs approximately 2 pounds. Develop and solve a linear optimization model to determine how many of each
grade of tile the company should make next week to maximize profit contribution.
Click here to view the tile data.
Complete the table below to indicate the number of square feet of each tile to produce to optimize the profit, and then
give the total profit earned.
(Type integers or decimals, Do not round.)
Grade I
Square Feet to Produce
Total Profit=$
Grade II
O
Grade Ill
Expert Solution
This question has been solved!
Explore an expertly crafted, step-by-step solution for a thorough understanding of key concepts.
This is a popular solution
Trending nowThis is a popular solution!
Step by stepSolved in 5 steps with 4 images

Knowledge Booster
Similar questions
- The cost of operating a bus involves the cost of gasoline , the driver's wage and other maintenance cost. Assume that the cost of Gasoline is $ 1.25 per litre , the driver earns $ 45 per hour , and maintenance cost is $ 0.18 per kilometre. If the fuel efficiency of the bus traveling at 80 Kilometres per hour is 9.6 litre per 100 kilometres, determine the cost of operating the bus (in Dollars) over a distance of 400 Kilometres. Enter your answer without units. Enter an integer or a fully reduced fraction such as 104 , 216 , 2056/7. etc. No spaces pleasearrow_forwardA manufacturer of skis produces two types: downhill and cross-country. The times required for manufacturing and finishing each ski are given in the table. The maximum total weekly hours available for manufacturing and finishing the skis are 108 hours and 20 hours, respectively. The profits per ski are $40 for downhill and $90 for cross-country. Determine how many of each kind of ski should be produced to achieve a maximum profit. Manufacturing time per ski Finishing time per ski Downhill 3 hours 0.5 hour Cross-country 2.5 hours 0.5 hour To achieve maximum profit, the manufacturer should produce downhill skis and cross-country skis. Carrow_forwardEspresso Express operates a number of espresso coffee stands in busy suburban malls. The fixed weekly expense of a coffee stand is $1,400 and the variable cost per cup of coffee served is $0.61. Required: 1. Fill in the following table with your estimates of the company's total cost and average cost per cup of coffee at the indicated levels of activity. 2. Does the average cost per cup of coffee served increase, decrease, or remain the same as the number of cups of coffee served in a week increases?arrow_forward
- need comprehensive and correct answers.This question is about optimization.arrow_forwardSuppose that a company needs 1,500,000 items during a year and that preparation for each production run costs $900. Suppose also that it costs $14 to produce each item and $3 per year to store an item. Use the inventory cost model to find the number of items in each production run so that the total costs of production and storage are minimized.arrow_forwardTurnover is planned at 2.5 for the six-month peris starting February 1 through July 31. Average weekly sales for that period are $75,000. What average stock should be carried in this situation? $800,000 $900,000 O $720,000 $780,000arrow_forward
- G.97.arrow_forwardA city of 70000 residents has an average water demand of 250 L/ca.day. The institutional and commercial, and industrial average areas in the city are 250 and 350 Ha, and water demand expected is 20 and 23 m3 /Ha.d. The public water use and water unaccounted for are 10 and 6 % of total municipal water demand, respectively. Calculate total municipal demand and each component quantity as a % of total municipal demand.arrow_forwardplease helparrow_forward
- A retailer anticipates selling 1,300 units of its product at a uniform rate over the next year. Each time the retailer places an order for a units, it is charged a flat fee of $25. Carrying costs are $26 per unit per year. How many times should the retailer reorder each year and what should be the lot size to minimize inventory costs? What is the minimum inventory cost? They should order units The minimum inventory cost is $ times a year.arrow_forwardConsider a person who invests in AAA-rated bonds, A-rated bonds, and B-rated bonds. The average yields are 6.5% on AAA bonds, 7% on A bonds, and 9% on B bonds. The person invests twice as much in B bonds as in A bonds. Let x, y and z represent the amounts invested in AAA, A, and B bonds, respectively. x + y + z = 10,000(total investment) 0.065x + 0.07y + 0.09z = 760(annual return) 2y – z = 0 Use the inverse of the coefficient matrix of this system to find the amount invested in each type of bond. Total Investment Annual Return $10,000 760arrow_forward
arrow_back_ios
arrow_forward_ios
Recommended textbooks for you
 Advanced Engineering MathematicsAdvanced MathISBN:9780470458365Author:Erwin KreyszigPublisher:Wiley, John & Sons, Incorporated
 Numerical Methods for EngineersAdvanced MathISBN:9780073397924Author:Steven C. Chapra Dr., Raymond P. CanalePublisher:McGraw-Hill Education
 Introductory Mathematics for Engineering Applicat...Advanced MathISBN:9781118141809Author:Nathan KlingbeilPublisher:WILEY
 Mathematics For Machine TechnologyAdvanced MathISBN:9781337798310Author:Peterson, John.Publisher:Cengage Learning,


Advanced Engineering Mathematics
Advanced Math
ISBN:9780470458365
Author:Erwin Kreyszig
Publisher:Wiley, John & Sons, Incorporated

Numerical Methods for Engineers
Advanced Math
ISBN:9780073397924
Author:Steven C. Chapra Dr., Raymond P. Canale
Publisher:McGraw-Hill Education

Introductory Mathematics for Engineering Applicat...
Advanced Math
ISBN:9781118141809
Author:Nathan Klingbeil
Publisher:WILEY

Mathematics For Machine Technology
Advanced Math
ISBN:9781337798310
Author:Peterson, John.
Publisher:Cengage Learning,

