MATLAB: An Introduction with Applications
6th Edition
ISBN: 9781119256830
Author: Amos Gilat
Publisher: John Wiley & Sons Inc
expand_more
expand_more
format_list_bulleted
Question

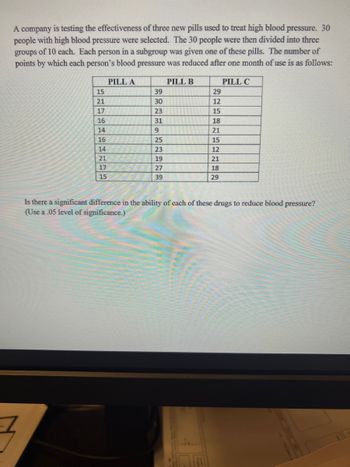
Transcribed Image Text:A company is testing the effectiveness of three new pills used to treat high blood pressure. 30
people with high blood pressure were selected. The 30 people were then divided into three
groups of 10 each. Each person in a subgroup was given one of these pills. The number of
points by which each person's blood pressure was reduced after one month of use is as follows:
PILL A
PILL B
7
15
21
17
16
14
16
14
21
17
15
PREHRANS
39
30
23
31
9
25
23
19
27
39
29
12
15
18
21
15
12
21
18
29
PILL C
Is there a significant difference in the ability of each of these drugs to reduce blood pressure?
(Use a .05 level of significance.)

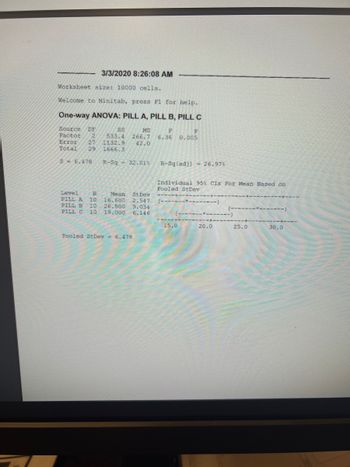
Transcribed Image Text:3/3/2020 8:26:08 AM
Worksheet size: 10000 cells.
Welcome to Minitab, press F1 for help.
One-way ANOVA: PILL A, PILL B, PILL C
Source DE
SS
MS
Factor 2 533.4 266.7
Error 27 1132.9 42.0
Total 29 1666.3
R-Sq 32.01%
S6.478
N
Mean St Dev
Level
PILL A 10
PILL B 10
16.600 2.547
26.500 9.034
PILL C 10 19.000 6.146
Pooled StDev 6.478
P
F
6.36 0.005
R-Sq (adj) - 26.97%
Individual 95% CIs For Mean Based on
Pooled StDev
----
(----
------
15.0
---)
20.0
(----
-----)
25.0
------)
---+----
30.0
Expert Solution
This question has been solved!
Explore an expertly crafted, step-by-step solution for a thorough understanding of key concepts.
This is a popular solution
Trending nowThis is a popular solution!
Step by stepSolved in 2 steps

Knowledge Booster
Similar questions
- A researcher was interested in how much longer the heart rate recovery time is for untrained college students compared to athletically trained college students. Eleven athletically untrained college students and nine athletically trained college students were put on a treadmill for fifteen minutes and then tested to see how many minutes it took for their heart rates to return to normal. The results of the study are shown below. Untrained: 8, 7, 7.2, 6.9, 7.8, 8.8, 8, 8, 8.8, 7.3, 8.6 Trained: 1.5, 1.5, 1.8, 2, 1.9, 2.3, 2.3, 2.4, 2.2 Assume both follow a Normal distribution. Compute the 95% confidence interval for the difference. Round to one decimal place. ( ___________ , _____________ )arrow_forwardA clinical psychologist wants to test the effectiveness of three new therapies that have been developed for reducing anxiety symptoms. The researcher recruits 15 participants and randomly assigns them to take part in Therapy A, Therapy B, or Therapy C for a month. At the end of the month, the researcher measures the participants' anxiety symptoms on a scale from 1 to 10 (where a higher score means more anxiety symptoms). The participants' scores are shown below: What is the appropriate test to use ? 3. What are the null and alternative hypotheses ? 4. Using a two-tailed alpha of .05, determine what the critical value is 5. Calculate the test statistic 6. State whether you reject or fail to reject the null hypothesis for the omnibus test 7. Calculate and report the effect size for the omnibus test 8. Perform a Post-Hoc Test. Report the significance of each pairwise comparisonarrow_forwardA randomly sampled group of patients at a major U.S. regional hospital became part of a nutrition study on dietary habits. Part of the study consisted of a 50-question survey asking about types of foods consumed. Each question was scored on a scale from one (most unhealthy behavior) to five (most healthy behavior). The answers were summed and averaged. The population of interest is the patients at the regional hospital. The current survey was implemented after patients were subjected to this education, and it produced the following sample statistics for 25 patients sampled: and s = 1.02. We would like to know if the education improved nutrition behavior. We test the hypotheses H 0: = 2.9 versus Ha: > 2.9. The value of the t test is 1.96, and: a. P-value > 0.1. b. 0.025 P-value < 0.05. c. 0.25 P-value < 0.01. d. 0.05 P-value < 0.1. Given the least squares regression line y = 3 x – 3, which of the following is true? a. The…arrow_forward
- A consumer group wanted to determine if there was a difference in customer perceptions about prices for a specific type of toy depending on where the toy was purchased. In the local area there are three main retailers: W-Mart, Tag, and URToy. For each retailer, the consumer group randomly selected 5 customers, and asked them to rate how expensive they thought the toy was on a 1-to-10 scale (1= not expensive, to 10 = very expensive). The toy was priced the same at all retail stores. Compute the percentage of variance explained by the group differences for these data. Q: Percentage and variance explained = ?arrow_forwardThe director of library services at a college did a survey of types of books (by subject) in the circulation library. Then she used library records to take a random sample of 888 books checked out last term and classified the books in the sample by subject. The results are shown below. Subject Area Percent of Books on Subject in CirculationLibrary on This Subject Number of Books inSample on This Subject Business 32% 284 Humanities 25% 218 Natural Science 20% 207 Social Science 15% 102 All other subjects 8% 77 (b) Find the value of the chi-square statistic for the sample. (Round the expected frequencies to three decimal places. Round the test statistic to three decimal places.)arrow_forwardSome commercial airlines recirculate about half the air in the cabin during flights as a way to improve fuel efficiency. Other airlines make a policy of NOT recirculating the air and instead, have fresh air from the atmosphere constantly being inserted into the cabin with the “old” air being pumped out of the plane. A total of 1100 passengers flying from San Francisco to Denver were used for an experiment. After their flight, they were each given a list of symptoms associated with the common cold. They were asked to report if they experienced cold symptoms within 24 hours of the flight landing. Of the 517 passengers who flew on planes that recirculate the air, 108 reported post-flight cold symptoms. Of the 583 passengers who flew on airlines that do not use recirculation in the cabin, 110 reported symptoms. Suppose now that we want to use the recirculation of air data to explore “Goal #2”, which is to resolve a hypothesis test about . a) If we want to resolve this hypothesis…arrow_forward
- A researcher working at Hershey's is interested in comparing two new chocolate bars: Chocolate Bar A versus Chocolate Bar B. The researcher expects the bars to be different in how much customers will eat per month. The researcher believes the more candy bars someone eats will indicate which one tastes the best. An experiment is designed to compare the two new bars. The number of candy bars eaten by one group of 8 people in a month is measured with Candy Bar A and then the number of candy bars eaten in the same month by another group of 8 participants is measured with Candy Bar B. Use the data below to determine if there is a difference in the consumption of the two candy bars. Candy Bar A Candy Bar B Number of Candy Bars eaten within a month 10, 30, 5, 35, 60, 3, 20, 30, 28, 27, 26, 27, 17, 25 12, 20 With a = .05, determine the critical value of t* that needs to be employed here. The value of the appropriate of t* is: 2.145 O 1.717 2.064 2.819 2.074 O The correct answer is not listed.arrow_forwardA consumer group wanted to determine if there was a difference in customer perceptions about prices for a specific type of toy depending on where the toy was purchased. In the local area there are three main retailers: W-Mart, Tag, and URToy. For each retailer, the consumer group randomly selected 5 customers, and asked them to rate how expensive they thought the toy was on a 1-to-10 scale (1= not expensive, to 10 = very expensive). The toy was priced the same at all retail stores. 1. What kind of statistical test should be used to test the consumer group's research goal, assuming that the researcher wanted to use the 1-to-10 scale as a numerical interval measure? A. Repeated-measures t-test B. One-way Independent Measures ANOVA C. Repeated-measures ANOVA D. Independent-measures t-test 2. State the hypothesis that aims to test the consumer group’s research goal (i.e., what is H0 and HA).arrow_forwardThe values listed below are waiting times (in minutes) of customers at two different banks. At Bank A, customers enter a single waiting line that feeds three teller windows. At Bank B, customers may enter any one of three different lines that have formed at three teller windows. Answer the following questions. Bank A 6.3 4.3 6.6 7.0 7.0 Bank B 5.4 5.8 6.1 6.8 78 8.5 10.0 A Click the icon to view the table of Chi-Square critical values. Construct a 95% confidence interval for the population standard deviation a at Bank A O minarrow_forwardarrow_back_iosarrow_forward_ios
Recommended textbooks for you
 MATLAB: An Introduction with ApplicationsStatisticsISBN:9781119256830Author:Amos GilatPublisher:John Wiley & Sons Inc
 Probability and Statistics for Engineering and th...StatisticsISBN:9781305251809Author:Jay L. DevorePublisher:Cengage Learning
 Statistics for The Behavioral Sciences (MindTap C...StatisticsISBN:9781305504912Author:Frederick J Gravetter, Larry B. WallnauPublisher:Cengage Learning
 Elementary Statistics: Picturing the World (7th E...StatisticsISBN:9780134683416Author:Ron Larson, Betsy FarberPublisher:PEARSON
 The Basic Practice of StatisticsStatisticsISBN:9781319042578Author:David S. Moore, William I. Notz, Michael A. FlignerPublisher:W. H. Freeman
 Introduction to the Practice of StatisticsStatisticsISBN:9781319013387Author:David S. Moore, George P. McCabe, Bruce A. CraigPublisher:W. H. Freeman

MATLAB: An Introduction with Applications
Statistics
ISBN:9781119256830
Author:Amos Gilat
Publisher:John Wiley & Sons Inc

Probability and Statistics for Engineering and th...
Statistics
ISBN:9781305251809
Author:Jay L. Devore
Publisher:Cengage Learning

Statistics for The Behavioral Sciences (MindTap C...
Statistics
ISBN:9781305504912
Author:Frederick J Gravetter, Larry B. Wallnau
Publisher:Cengage Learning

Elementary Statistics: Picturing the World (7th E...
Statistics
ISBN:9780134683416
Author:Ron Larson, Betsy Farber
Publisher:PEARSON

The Basic Practice of Statistics
Statistics
ISBN:9781319042578
Author:David S. Moore, William I. Notz, Michael A. Fligner
Publisher:W. H. Freeman

Introduction to the Practice of Statistics
Statistics
ISBN:9781319013387
Author:David S. Moore, George P. McCabe, Bruce A. Craig
Publisher:W. H. Freeman