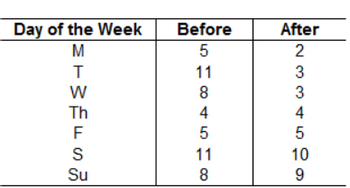
A city wants to know if a new advertising campaign to make citizens aware of the dangers of driving after drinking has been effective. The accompanying table shows the number of drivers who have been stopped with more alcohol in their systems than the law allows for each day of the week in the week before and the week a month after the campaign starts. Assume that the data from each population is
D. Compute the standard error of the
E. Find the value of the t-statistic.
F. How many degrees of freedom does the t-statistic have?
G. Is the alternative one- or two-sided? Explain.
H. What is the P-value associated with this t-statistic? Assume that the other assumptions and conditions for inference are met.
I) At alpha = 0.10, what do you conclude?

Trending nowThis is a popular solution!
Step by stepSolved in 4 steps

- the table below shows the number of books the Jefferson Middle school students readeach month for nine months. Month Sept. Oct. Nov. Dec. Jan. Feb. Mar. Apr. May Number of Books 293 280 266 280 289 279 275 296 271 If the students read only 101 books for the month of June, which measure of central tendency will have the greatest change?A. The mean will have the greatest change.B. The median will have the greatest change.C. All measures will have an equal change.D. The mode will have the greatest change.arrow_forward5.Identify the following as being discrete or continuous data. Explain.a. The average number of pets was 1.823b. The puppy weighed 2 poundsarrow_forward1. These are the distances, in kilometres, students in a class travel to school. 1.1, 3.3, 2.3, 0.4, 0.9, 2.8, 1.8, 1.8, 2.4, 1.3, 0.4 Find the mean, median and mode for this data. What are the quartiles for this data set? Show all your work.arrow_forward
- 3. The data in the table shows the mileage that students commute to school. B. Find the weighted mean. Miles Midpoint Frequency 10 - 14 12 8 15 - 19 17 C. Draw a histogram for the data. 20 - 24 22 9 25 - 29 27 21 30 - 34 32 7 A. How many students are in the class?arrow_forwardThe following data that belongs to a population: 4 -5 2 0 -10 14 12 8 Calculate the mean, median and mode. Round your answer to two decimal places if it is necessary Mean= Median= Mode=arrow_forwardPlease help with the areas marked with an X To test whether the mean time needed to mix a batch of material is the same for machines produced by three manufacturers, the Jacobs Chemical Company obtained the following data on the time (in minutes) needed to mix the material. Manufacturer 1 2 3 19 29 16 25 27 15 23 32 19 21 28 18 a. Use these data to test whether the population mean times for mixing a batch of material differ for the three manufacturers. Use . Sum of Squares, Treatment X Sum of Squares, Error X Mean Squares, Treatment X Mean Squares, Error X Compute the values below (to decimals, if necessary). Calculate the value of the test statistic (to decimals)_______x_________. b. At the level of significance, use Fisher's LSD procedure to test for the equality of the means for manufacturers and . Calculate Fisher's LSD Value (to decimals)______X______arrow_forward
- Which of these is an advantage of using a transformed score when reporting the score of an individual case? a. Transformed scores will allow the mean score to be reported. b. Transformed scores will be reported on the nominal level. c. Transformed scores provide a context for the individual's score d. Transformed scores provide a measure of variability.arrow_forwardWhich one of the following summary statistics best matches the data on the abundance of various bird species shown here? Frequency (No. species) 25 20 15 10 5 0 0 Mean = Mean = Mean = 100 200 300 400 500 600 Abundance (No. individuals) 75 individuals, s.d. = 122 individuals 300 individuals, s.d. = 14871 individuals 10 individuals, s.d. = 10 individuals Mean = 10 individuals, s.d. = 14871 individuals Mean 75 individuals, s.d. = 14871 individualsarrow_forwardA city wants to know if a new advertising campaign to make citizens aware of the dangers of driving after drinking has been effective. The accompanying table shows the number of drivers who have been stopped with more alcohol in their systems than the law allows for each day of the week in the week before and the week a month after the campaign starts. Assume that the data from each population is Normally distributed. Complete parts a through i below. A. Are the data paired? Explain. B. Compute the mean difference C. Compute the standard deviation of the differences. D. Compute the standard error of the mean difference. E. Find the value of the t-statistic. F. How many degrees of freedom does the t-statistic have? G. Is the alternative one- or two-sided? Explain. H. What is the P-value associated with this t-statistic? Assume that the other assumptions and conditions for inference are met.arrow_forward
 MATLAB: An Introduction with ApplicationsStatisticsISBN:9781119256830Author:Amos GilatPublisher:John Wiley & Sons Inc
 Probability and Statistics for Engineering and th...StatisticsISBN:9781305251809Author:Jay L. DevorePublisher:Cengage Learning
 Statistics for The Behavioral Sciences (MindTap C...StatisticsISBN:9781305504912Author:Frederick J Gravetter, Larry B. WallnauPublisher:Cengage Learning
 Elementary Statistics: Picturing the World (7th E...StatisticsISBN:9780134683416Author:Ron Larson, Betsy FarberPublisher:PEARSON
 The Basic Practice of StatisticsStatisticsISBN:9781319042578Author:David S. Moore, William I. Notz, Michael A. FlignerPublisher:W. H. Freeman
 Introduction to the Practice of StatisticsStatisticsISBN:9781319013387Author:David S. Moore, George P. McCabe, Bruce A. CraigPublisher:W. H. Freeman


