
MATLAB: An Introduction with Applications
6th Edition
ISBN: 9781119256830
Author: Amos Gilat
Publisher: John Wiley & Sons Inc
expand_more
expand_more
format_list_bulleted
Related questions
Question
Some dairy cows receive injections of BST, a hormone intended to spur greater milk production. After the first injection, a test herd of 101 cows increased their
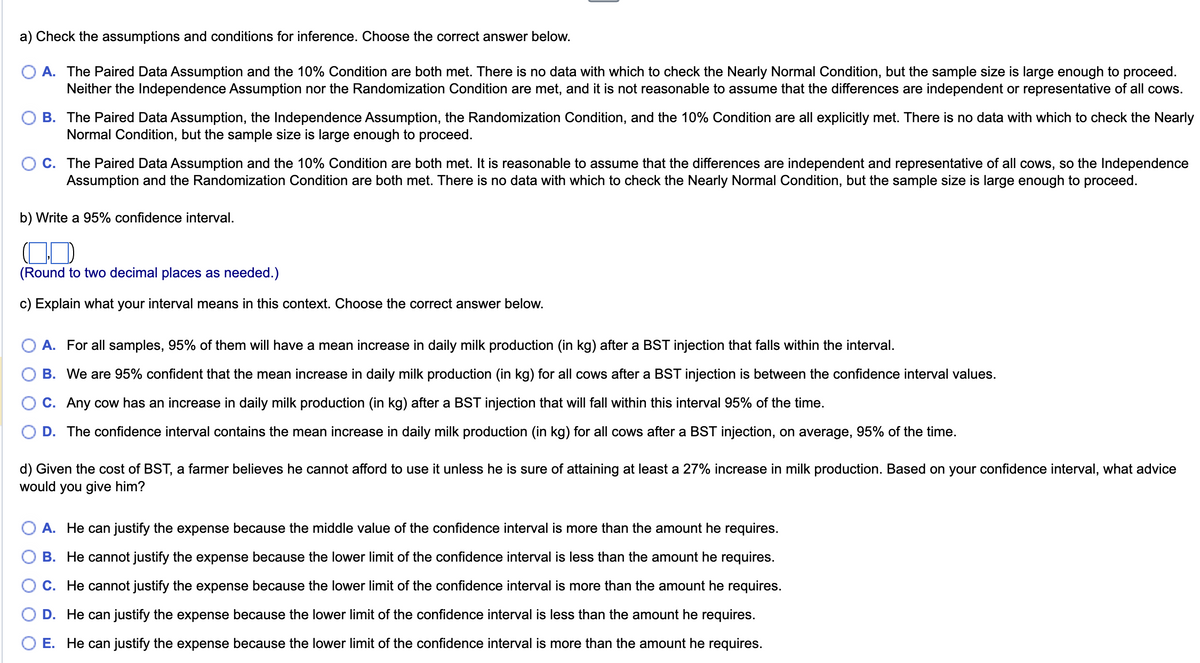

Transcribed Image Text:a) Check the assumptions and conditions for inference. Choose the correct answer below.
A. The Paired Data Assumption and the 10% Condition are both met. There is no data with which to check the Nearly Normal Condition, but the sample size is large enough to proceed.
Neither the Independence Assumption nor the Randomization Condition are met, and it is not reasonable to assume that the differences are independent or representative of all cows.
B. The Paired Data Assumption, the Independence Assumption, the Randomization Condition, and the 10% Condition are all explicitly met. There is no data with which to check the Nearly
Normal Condition, but the sample size is large enough to proceed.
C. The Paired Data Assumption and the 10% Condition are both met. It is reasonable to assume that the differences are independent and representative of all cows, so the Independence
Assumption and the Randomization Condition are both met. There is no data with which to check the Nearly Normal Condition, but the sample size is large enough to proceed.
b) Write a 95% confidence interval.
(Round to two decimal places as needed.)
c) Explain what your interval means in this context. Choose the correct answer below.
A. For all samples, 95% of them will have a mean increase in daily milk production (in kg) after a BST injection that falls within the interval.
B. We are 95% confident that the mean increase in daily milk production (in kg) for all cows after a BST injection is between the confidence interval values.
C. Any cow has an increase in daily milk production (in kg) after a BST injection that will fall within this interval 95% of the time.
D. The confidence interval contains the mean increase in daily milk production (in kg) for all cows after a BST injection, on average, 95% of the time.
d) Given the cost of BST, a farmer believes he cannot afford to use it unless he is sure of attaining at least a 27% increase in milk production. Based on your confidence interval, what advice
would you give him?
A. He can justify the expense because the middle value of the confidence interval is more than the amount he requires.
B. He cannot justify the expense because the lower limit of the confidence interval is less than the amount he requires.
C. He cannot justify the expense because the lower limit of the confidence interval is more than the amount he requires.
D. He can justify the expense because the lower limit of the confidence interval is less than the amount he requires.
E. He can justify the expense because the lower limit of the confidence interval is more than the amount he requires.
Expert Solution
This question has been solved!
Explore an expertly crafted, step-by-step solution for a thorough understanding of key concepts.

This is a popular solution

Trending nowThis is a popular solution!

Step by stepSolved in 3 steps with 1 images

Knowledge Booster

Similar questions
- A livestock company reports that the mean weight of a group of young steers is 1172pounds with a standard deviation of 70pounds. Based on the model N(1172,70)for the weights of steers, what percent of steers weigha) over 1100pounds?b) under 1250pounds?c) between 1200 and 1300 pounds?arrow_forwardCan you answer c,d, and e pleasearrow_forwarda standarized reading exam has a mean score of 80 with standard deviation =12. the distribution of scores i normal. Find the percentage of test takers who got: a) under 80 b) between 68 and 92 c) over 100 d) over 25 e) what is the 40th percentile?arrow_forward
- Diastolic blood pressures are assumed to follow a normal distribution with a mean of 85 and a standard deviation of 12. What proportion of people has diastolic blood pressures less than 80? A)0.661 B)0.338 C)0.50 D)0.75arrow_forwardThe IQ of a person follows a normal distribution and has a mean of 100 and a standard deviation of 15. What percentage of the people have IQ scores between 70 and 130? A) 95% B) 50% C) 2.5% D) 68%arrow_forwardRivets. A company that manufactures rivets believesthe shear strength of the rivets they manufacture followsa Normal model with a mean breaking strength of 950pounds and a standard deviation of 40 pounds.a) What percentage of rivets selected at random willbreak when tested under a 900-pound load? b) You’re trying to improve the rivets and want to exam-ine some that fail. Use a simulation to estimate how many rivets you might need to test in order to findthree that fail at 900 pounds (or below).arrow_forward
- The distribution of weights for 12-month-old baby boys in the US is approximately normal with mean u = 22.5 pounds and standard deviation o = 2.2 pounds. a) If a 12-month-old boy weighs 20.3 pounds, approximately what weight percentile is he in? b) If a 12-month-old boy is in the 84th percentile in weight, estimate his weight. c) Estimate the weight of a 12-month-old boy who is in the 25th percentile by weight. d) Estimate the weight of a 12-month-old boy who is in the 75th percentile by weight.arrow_forwardAssume the cholesterol levels of an adult can be described by a Normal model with a mean of 183 mg/dL and a standard deviation of 27. Complete parts a through e. b) What percent of adults do you expect to have cholesterol levels over 190 mg/dL? enter your response here % (Round to two decimal places as needed.) Part 3 c) What percent of adults do you expect to have cholesterol levels between 150 and 160 mg/dL? enter your response here % (Round to two decimal places as needed.) Part 4 d) Estimate the interquartile range of cholesterol levels. IQR=enter your response here mg/dL (Round to the nearest integer as needed.) Part 5 e) Above what value are the highest 15% of adults' cholesterol levels? enter your response here mg/dL (Round to the nearest integer as needed.)arrow_forwardBoth sets of values have an average of 20. Is Set A's standard deviation smaller, larger, or about the same as Set B's? Hint: A person can answer this question mostly by looking at the values without performing any substantial calculations. Set A: 2 11 29 38 Set B: 15 19 21 25 a) about the same b) larger c) smallerarrow_forward
arrow_back_ios
arrow_forward_ios
Recommended textbooks for you
- MATLAB: An Introduction with ApplicationsStatisticsISBN:9781119256830Author:Amos GilatPublisher:John Wiley & Sons Inc
 Probability and Statistics for Engineering and th...StatisticsISBN:9781305251809Author:Jay L. DevorePublisher:Cengage Learning
 Statistics for The Behavioral Sciences (MindTap C...StatisticsISBN:9781305504912Author:Frederick J Gravetter, Larry B. WallnauPublisher:Cengage Learning
  Elementary Statistics: Picturing the World (7th E...StatisticsISBN:9780134683416Author:Ron Larson, Betsy FarberPublisher:PEARSON
 The Basic Practice of StatisticsStatisticsISBN:9781319042578Author:David S. Moore, William I. Notz, Michael A. FlignerPublisher:W. H. Freeman
 Introduction to the Practice of StatisticsStatisticsISBN:9781319013387Author:David S. Moore, George P. McCabe, Bruce A. CraigPublisher:W. H. Freeman
MATLAB: An Introduction with Applications
Statistics
ISBN:9781119256830
Author:Amos Gilat
Publisher:John Wiley & Sons Inc
Probability and Statistics for Engineering and th...
Statistics
ISBN:9781305251809
Author:Jay L. Devore
Publisher:Cengage Learning
Statistics for The Behavioral Sciences (MindTap C...
Statistics
ISBN:9781305504912
Author:Frederick J Gravetter, Larry B. Wallnau
Publisher:Cengage Learning
Elementary Statistics: Picturing the World (7th E...
Statistics
ISBN:9780134683416
Author:Ron Larson, Betsy Farber
Publisher:PEARSON
The Basic Practice of Statistics
Statistics
ISBN:9781319042578
Author:David S. Moore, William I. Notz, Michael A. Fligner
Publisher:W. H. Freeman
Introduction to the Practice of Statistics
Statistics
ISBN:9781319013387
Author:David S. Moore, George P. McCabe, Bruce A. Craig
Publisher:W. H. Freeman