
MATLAB: An Introduction with Applications
6th Edition
ISBN: 9781119256830
Author: Amos Gilat
Publisher: John Wiley & Sons Inc
expand_more
expand_more
format_list_bulleted
Related questions
Question
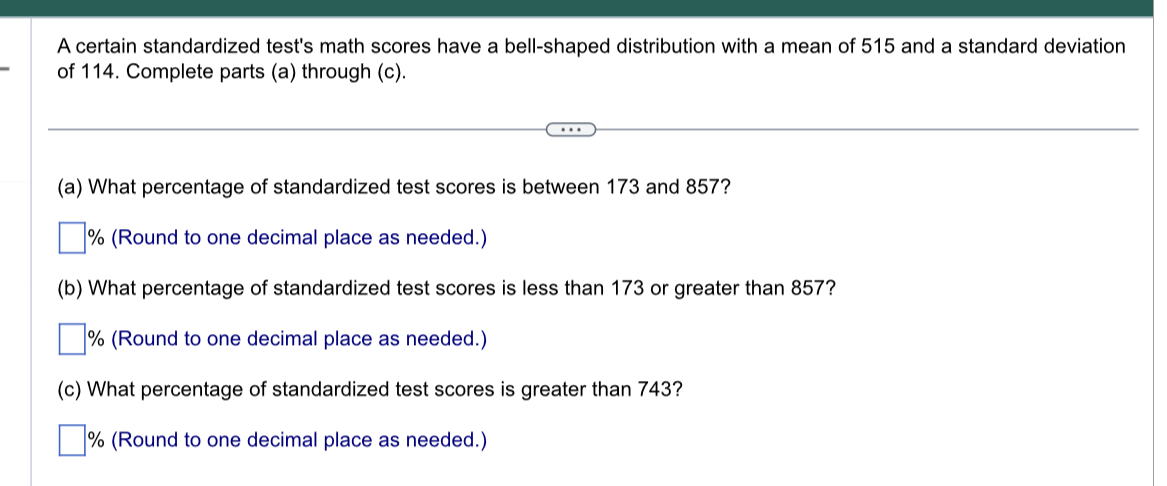

Transcribed Image Text:A certain standardized test's math scores have a bell-shaped distribution with a mean of 515 and a standard deviation
of 114. Complete parts (a) through (c).
(a) What percentage of standardized test scores is between 173 and 857?
% (Round to one decimal place as needed.)
(b) What percentage of standardized test scores is less than 173 or greater than 857?
% (Round to one decimal place as needed.)
(c) What percentage of standardized test scores is greater than 743?
% (Round to one decimal place as needed.)
Expert Solution
This question has been solved!
Explore an expertly crafted, step-by-step solution for a thorough understanding of key concepts.

This is a popular solution

Trending nowThis is a popular solution!

Step by stepSolved in 5 steps with 36 images

Knowledge Booster

Similar questions
- If your score on your next statistics test is converted to a z score, which of these z scores would you prefer: - 2.00, - 1.00, 0, 1.00, 2.00? Why? OA The z score of 1.00 is most preferable because it is 1.00 standard deviation above the mean and would correspond to an above average test score. O B. The z score of 0 is most preferable because it corresponds to a test score equal to the mean. OC. The z score of - 1.00 is most preferable because it is 1.00 standard deviation below the mean and would correspond to an above average test score. OD. The z score of 2.00 is most preferable because it is 2.00 standard deviations above the mean and would correspond to the highest of the five different possible test scores. O E. The z score of -2.00 is most preferable because it is 2.00 standard deviations below the mean and would correspond to the highest of the five different possible test scores. O Time MacBook PrO -> G Search or type URL esc ! @ #3 2$ % 2 4 6. 7 8 R Y P Q tab A S F G K caps…arrow_forwardWhich of the following is an example of doing inferential statistics? You calculate the average grade on an exam in a class of 5th grade math students to see if they did better or worse than last year. You lookup the median and the standard deviation of the age for the U.S. population from U.S. Census data. You use a sample of homes in Rancho Cucamonga to draw a conclusion about the mean home price for all Rancho Cucamonga homes. You compare the distributions of scores for two Social Science 10 classes to see which class did better on the exam.arrow_forwardAn Excel assignment counts for 0-10 points. The scores in a class of 12 students are recorded as follows:1 5 5 6 7 7 8 8 8 9 10 10 What is the deviation of the score 10 from the mean in 13a (recall that this involves a subtraction of the mean from the particular score)? I think I got answer but want to check.arrow_forward
- On a nationwide test taken by high school students, the mean score was 51 and the standard deviation was 13. The scores were normally distributed. Complete the following statements. (a) Approximately ? of the students scored between 38 and 64. (b) Approximately 95% of the students scored between and .arrow_forwardI’ve already posted this one, but I’m posting it again, because I need to be shown what to input into my TI-84 Plus calculator to solve.arrow_forwardThe Truly Amazing Dudes are a group of comic acrobats. The weights (in pounds) of the ten acrobats are as follows. 146 192 174 177 159 87 178 152 144 148 (a) Find the mean and sample standard deviation of the weights. (Round your answers to one decimal place.) mean 155.7 lbs standard deviation ? lbs (b) What percent of the data lies within one standard deviation of the mean? %(c) What percent of the data lies within two standard deviations of the mean? %arrow_forward
arrow_back_ios
arrow_forward_ios
Recommended textbooks for you
- MATLAB: An Introduction with ApplicationsStatisticsISBN:9781119256830Author:Amos GilatPublisher:John Wiley & Sons Inc
 Probability and Statistics for Engineering and th...StatisticsISBN:9781305251809Author:Jay L. DevorePublisher:Cengage Learning
 Statistics for The Behavioral Sciences (MindTap C...StatisticsISBN:9781305504912Author:Frederick J Gravetter, Larry B. WallnauPublisher:Cengage Learning
  Elementary Statistics: Picturing the World (7th E...StatisticsISBN:9780134683416Author:Ron Larson, Betsy FarberPublisher:PEARSON
 The Basic Practice of StatisticsStatisticsISBN:9781319042578Author:David S. Moore, William I. Notz, Michael A. FlignerPublisher:W. H. Freeman
 Introduction to the Practice of StatisticsStatisticsISBN:9781319013387Author:David S. Moore, George P. McCabe, Bruce A. CraigPublisher:W. H. Freeman
MATLAB: An Introduction with Applications
Statistics
ISBN:9781119256830
Author:Amos Gilat
Publisher:John Wiley & Sons Inc
Probability and Statistics for Engineering and th...
Statistics
ISBN:9781305251809
Author:Jay L. Devore
Publisher:Cengage Learning
Statistics for The Behavioral Sciences (MindTap C...
Statistics
ISBN:9781305504912
Author:Frederick J Gravetter, Larry B. Wallnau
Publisher:Cengage Learning
Elementary Statistics: Picturing the World (7th E...
Statistics
ISBN:9780134683416
Author:Ron Larson, Betsy Farber
Publisher:PEARSON
The Basic Practice of Statistics
Statistics
ISBN:9781319042578
Author:David S. Moore, William I. Notz, Michael A. Fligner
Publisher:W. H. Freeman
Introduction to the Practice of Statistics
Statistics
ISBN:9781319013387
Author:David S. Moore, George P. McCabe, Bruce A. Craig
Publisher:W. H. Freeman