
MATLAB: An Introduction with Applications
6th Edition
ISBN: 9781119256830
Author: Amos Gilat
Publisher: John Wiley & Sons Inc
expand_more
expand_more
format_list_bulleted
Related questions
Concept explainers
Topic Video
Question
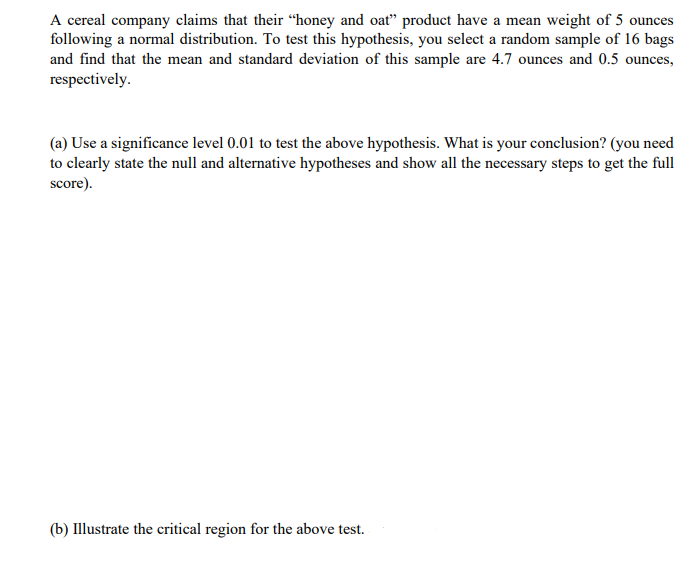

Transcribed Image Text:A cereal company claims that their "honey and oat" product have a mean weight of 5 ounces
following a normal distribution. To test this hypothesis, you select a random sample of 16 bags
and find that the mean and standard deviation of this sample are 4.7 ounces and 0.5 ounces,
respectively.
(a) Use a significance level 0.01 to test the above hypothesis. What is your conclusion? (you need
to clearly state the null and alternative hypotheses and show all the necessary steps to get the full
score).
(b) Illustrate the critical region for the above test.
Expert Solution
This question has been solved!
Explore an expertly crafted, step-by-step solution for a thorough understanding of key concepts.

Step by stepSolved in 2 steps

Knowledge Booster


Learn more about
Need a deep-dive on the concept behind this application? Look no further. Learn more about this topic, statistics and related others by exploring similar questions and additional content below.Similar questions
- A study was done on body temperatures of men and women. The results are shown in the table. Assume that the two samples are independent simple random samples selected from normally distributed populations, and do not assume that the population standard deviations are equal. Complete parts (a) and (b) below. Use a 0.01 significance level for both parts. a. Test the claim that the two samples are from populations with the same mean. What are the null and alternative hypotheses? What is the test statistic, t? What is the P-value? State the conclusion for the test. b. Construct a confidence interval suitable for testing the claim that the two samples are from populations with the same mean.arrow_forwardYou are interested in testing whether the average age of household heads is higher in the suburbs than in inner city neighbourhoods. A survey is conducted, and the following results are obtained. In the suburbs, the household heads of the 45 households surveyed had a mean age of 44 with a standard deviation of 15. In the inner city, the mean age of the 40 household heads surveyed was 38 with a standard deviation of 13. Assuming that the populations from which these samples were drawn have equal variances, can you conclude that the difference between the two means is significant at the 95% level of confidence? (a) Write in words and symbols the null and research hypotheses. (b) Assuming the variances of the populations are equal, calculate the value of the Pooled Variance Estimate (PVE). (c) Calculate the value of the standard error for the difference between the two means.arrow_forwardAccording to a large oil company, the average cost per barrel of oil last year was $47. You believe that due to the current oil crisis in Russia and Iran that the cost of a barrel of oil has decreased. You collect a simple random sample of 60 barrels of oil and find an average price of $42 and a standard deviation of $12. Use this information to answer the following questions and conduct the hypothesis test with a level of significance of a = .01. You may use Statcrunch or a calculator. Write all non-calculation answers in complete sentences. a. Which test would you use and why? b. Write the null and alternative hypothesis in complete sentences. (Make sure you mark which is the null and which is the alternative.) c. Write the null and alternative hypothesis as symbols. d. State the requirements that have been met to run the test. e. What is the test statistic and the p-value? (Make sure you use the right notation.) f. Should you reject or fail to reject the null hypothesis? g. State…arrow_forward
- A study was done using a treatment group and a placebo group. The results are shown in the table. Assume that the two samples are independent simple random samples selected from normally distributed populations, and do not assume that the population standard deviations are equal. Complete parts (a) and (b) below. Use a 0.10 significance level for both parts. a. Test the claim that the two samples are from populations with the same mean. What are the null and alternative hypotheses? OA. Ho: H₁ H₂ H₁: Hq ZH₂ OC. Ho: H₁ H₂ H₁: Hy > H₂ The test statistic, t, is. (Round to two decimal places as needed.) (Round to three decimal places as needed.) The P-value is State the conclusion for the test. C... OB. Ho: H₁ H₂ H₁: Hy #H₂ OD. Ho: Hg #U2 H₁: Hyarrow_forwardYou are testing the claim that smiling, rather than remaining neutral, during a court proceding will lead to a different punishment from the judge.A sample of 34 people who smiled during their hearing and 34 people who kept neutral facial expressions during their hearing is taken and each judgment was rated for leniency. Those who smiled (population 1) had a mean leniency rating of 4.9 with a standard deviation of 1.7, while those who did not smile (population 2) had an average leniency rating of 4.1 and standard deviation 1.5. Test the claim using a 5% level of significance.What are the correct hypotheses?H0: Ha: Based on the hypotheses, find the following:Test Statistic = p-value = The correct decision is to .The correct summary would be: that there is a difference in leniency when smiling over being neutral when in trouble.arrow_forwardGestation period is the length of pregnancy, or to be more precise, the interval between fertilization and birth. In Syrian hamsters, the average gestation period is 16 days. Suppose you have a sample of 31 Syrian hamsters who were exposed to high levels of the hormone progesterone when they were pups, and who have an average gestation length of 17.1 days and a sample variance of 26.0 days. You want to test the hypothesis that Syrian hamsters who were exposed to high levels of the hormone progesterone when they were pups have a different gestation length than all Syrian hamsters. Calculate the t statistic. To do this, you first need to calculate the estimated standard error. The estimated standard error is sMM= a. 31, b. 0.5232, c. 0.7328, d. 0.9158. The t statistic is- a. 1.50, b. 2.10, c. 2.63, d. 1.20 Now suppose you have a larger sample size n = 95. Calculate the estimated standard error and the t statistic for this sample with the same sample average and the same…arrow_forward
- A study was done using a treatment group and a placebo group. The results are shown in the table. Assume that the two samples are independent simple random samples selected from normally distributed populations, and do not assume that the population standard deviations are equal. Complete parts (a) and (b) below. Use a 0.01 significance level for both parts. a. Test the claim that the two samples are from populations with the same mean. What are the null and alternative hypotheses? OA. Ho H1 H2 H₁: H1 H2 The test statistic, t, is -1.55. (Round to two decimal places as needed.) The P-value is (Round to three decimal places as needed.) OB. Ho: H1 H2 H₁₁₂ D. Ho: H1 H2 H₁: H1 H2 Treatment Placebo μ H₁ H2 n 25 40 X 2.38 2.65 S 0.53 0.87arrow_forwardAn article in the San Jose Mercury News stated that students in the California state university system take 6 years, on average, to finish their undergraduate degrees. A freshman student believes that the mean time is less and conducts a survey of 53 students. The student obtains a sample mean of 4.1 with a sample standard deviation of 1.9. Is there sufficient evidence to support the student's claim at an �=0.1 significance level? Test the claim: Determine the null and alternative hypotheses. Enter correct symbol and value.�0: �=Incorrect��: � Correct< Incorrect Determine the test statistic. Round to four decimal places.�=Incorrect Find the �-value. Round to 4 decimals.arrow_forwardWater usage is closely watched in many parts of Australia. Suppose that in a summer the average household usage in Hobart is 408 litres per day. A year later it examines records of a sample of 50 households and finds that there is a daily mean usage of 380 litres with a standard deviation of 25 litres. a.Do you think the average daily water usage has been changed in the second summer? Use the 5% level of significance level for hypothesis testing. b.Because of the draught situation in Australia, after the first summer, the price of water in Hobart was increased to encourage households to reduce their water consumption. How do you evaluate the effect of increasing water prices? Use the 5% level of significance level for hypothesis testing.arrow_forward
arrow_back_ios
arrow_forward_ios
Recommended textbooks for you
- MATLAB: An Introduction with ApplicationsStatisticsISBN:9781119256830Author:Amos GilatPublisher:John Wiley & Sons Inc
 Probability and Statistics for Engineering and th...StatisticsISBN:9781305251809Author:Jay L. DevorePublisher:Cengage Learning
 Statistics for The Behavioral Sciences (MindTap C...StatisticsISBN:9781305504912Author:Frederick J Gravetter, Larry B. WallnauPublisher:Cengage Learning
  Elementary Statistics: Picturing the World (7th E...StatisticsISBN:9780134683416Author:Ron Larson, Betsy FarberPublisher:PEARSON
 The Basic Practice of StatisticsStatisticsISBN:9781319042578Author:David S. Moore, William I. Notz, Michael A. FlignerPublisher:W. H. Freeman
 Introduction to the Practice of StatisticsStatisticsISBN:9781319013387Author:David S. Moore, George P. McCabe, Bruce A. CraigPublisher:W. H. Freeman
MATLAB: An Introduction with Applications
Statistics
ISBN:9781119256830
Author:Amos Gilat
Publisher:John Wiley & Sons Inc
Probability and Statistics for Engineering and th...
Statistics
ISBN:9781305251809
Author:Jay L. Devore
Publisher:Cengage Learning
Statistics for The Behavioral Sciences (MindTap C...
Statistics
ISBN:9781305504912
Author:Frederick J Gravetter, Larry B. Wallnau
Publisher:Cengage Learning
Elementary Statistics: Picturing the World (7th E...
Statistics
ISBN:9780134683416
Author:Ron Larson, Betsy Farber
Publisher:PEARSON
The Basic Practice of Statistics
Statistics
ISBN:9781319042578
Author:David S. Moore, William I. Notz, Michael A. Fligner
Publisher:W. H. Freeman
Introduction to the Practice of Statistics
Statistics
ISBN:9781319013387
Author:David S. Moore, George P. McCabe, Bruce A. Craig
Publisher:W. H. Freeman