
MATLAB: An Introduction with Applications
6th Edition
ISBN: 9781119256830
Author: Amos Gilat
Publisher: John Wiley & Sons Inc
expand_more
expand_more
format_list_bulleted
Related questions
Question
Please asssit with questions (e - iii) (e - iv) and (e - v) as highlighted in red
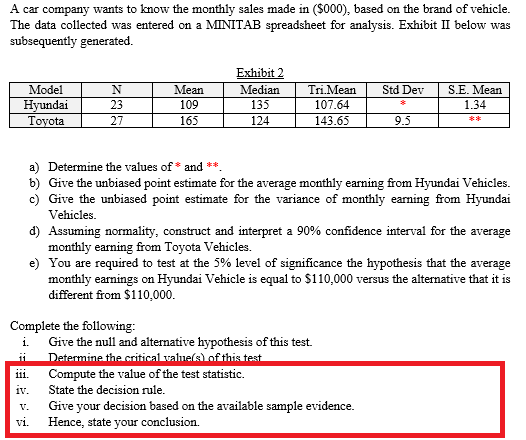

Transcribed Image Text:A car company wants to know the monthly sales made in ($000), based on the brand of vehicle.
The data collected was entered on a MINITAB spreadsheet for analysis. Exhibit II below was
subsequently generated.
Exhibit 2
Model
Mean
Median
Tri.Mean
Std Dev
S.E. Mean
Hyundai
Toyota
135
109
165
23
107.64
1.34
27
124
143.65
9.5
**
a) Determine the values of * and **.
b) Give the unbiased point estimate for the average monthly earning from Hyundai Vehicles.
c) Give the unbiased point estimate for the variance of monthly earning from Hyundai
Vehicles.
d) Assuming normality, construct and interpret a 90% confidence interval for the average
monthly earning from Toyota Vehicles.
e) You are required to test at the 5% level of significance the hypothesis that the average
monthly earnings on Hyundai Vehicle is equal to $110,000 versus the alternative that it is
different from $110,000.
Complete the following:
i. Give the null and alternative hypothesis of this test.
Determine the criticalvalue(s)of this test
Compute the value of the test statistic.
iv.
iii.
State the decision rule.
Give your decision based on the available sample evidence.
Hence, state your conclusion.
V.
vi.
Expert Solution
This question has been solved!
Explore an expertly crafted, step-by-step solution for a thorough understanding of key concepts.

Step by stepSolved in 2 steps

Knowledge Booster


Learn more about
Need a deep-dive on the concept behind this application? Look no further. Learn more about this topic, statistics and related others by exploring similar questions and additional content below.Similar questions
arrow_back_ios
arrow_forward_ios
Recommended textbooks for you
- MATLAB: An Introduction with ApplicationsStatisticsISBN:9781119256830Author:Amos GilatPublisher:John Wiley & Sons Inc
 Probability and Statistics for Engineering and th...StatisticsISBN:9781305251809Author:Jay L. DevorePublisher:Cengage Learning
 Statistics for The Behavioral Sciences (MindTap C...StatisticsISBN:9781305504912Author:Frederick J Gravetter, Larry B. WallnauPublisher:Cengage Learning
  Elementary Statistics: Picturing the World (7th E...StatisticsISBN:9780134683416Author:Ron Larson, Betsy FarberPublisher:PEARSON
 The Basic Practice of StatisticsStatisticsISBN:9781319042578Author:David S. Moore, William I. Notz, Michael A. FlignerPublisher:W. H. Freeman
 Introduction to the Practice of StatisticsStatisticsISBN:9781319013387Author:David S. Moore, George P. McCabe, Bruce A. CraigPublisher:W. H. Freeman
MATLAB: An Introduction with Applications
Statistics
ISBN:9781119256830
Author:Amos Gilat
Publisher:John Wiley & Sons Inc
Probability and Statistics for Engineering and th...
Statistics
ISBN:9781305251809
Author:Jay L. Devore
Publisher:Cengage Learning
Statistics for The Behavioral Sciences (MindTap C...
Statistics
ISBN:9781305504912
Author:Frederick J Gravetter, Larry B. Wallnau
Publisher:Cengage Learning
Elementary Statistics: Picturing the World (7th E...
Statistics
ISBN:9780134683416
Author:Ron Larson, Betsy Farber
Publisher:PEARSON
The Basic Practice of Statistics
Statistics
ISBN:9781319042578
Author:David S. Moore, William I. Notz, Michael A. Fligner
Publisher:W. H. Freeman
Introduction to the Practice of Statistics
Statistics
ISBN:9781319013387
Author:David S. Moore, George P. McCabe, Bruce A. Craig
Publisher:W. H. Freeman