
Algebra & Trigonometry with Analytic Geometry
13th Edition
ISBN: 9781133382119
Author: Swokowski
Publisher: Cengage
expand_more
expand_more
format_list_bulleted
Related questions
Question
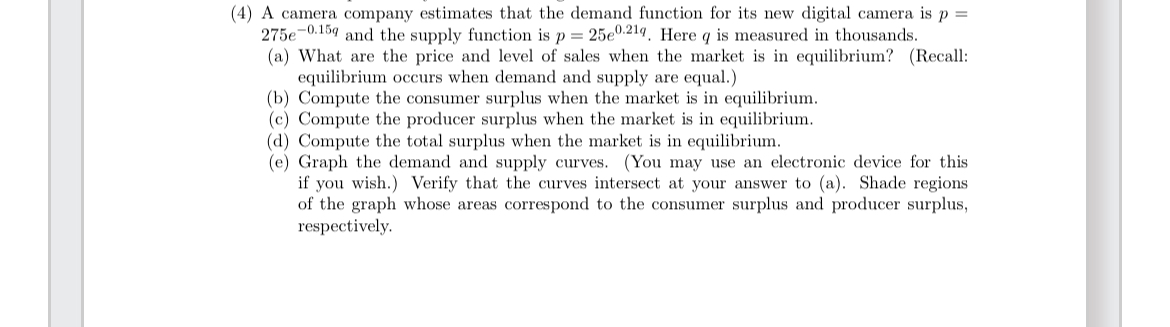

Transcribed Image Text:(4) A camera company estimates that the demand function for its new digital camera is p =
275e-0.159 and the supply function is p = 25e0.219. Here q is measured in thousands.
(a) What are the price and level of sales when the market is in equilibrium? (Recall:
equilibrium occurs when demand and supply are equal.)
(b) Compute the consumer surplus when the market is in equilibrium.
(c) Compute the producer surplus when the market is in equilibrium.
(d) Compute the total surplus when the market is in equilibrium.
(e) Graph the demand and supply curves. (You may use an electronic device for this
if you wish.) Verify that the curves intersect at your answer to (a). Shade regions
of the graph whose areas correspond to the consumer surplus and producer surplus,
respectively.
Expert Solution
This question has been solved!
Explore an expertly crafted, step-by-step solution for a thorough understanding of key concepts.

Step by stepSolved in 4 steps with 3 images

Knowledge Booster

Similar questions
- Redo Exercise 5, assuming that the house blend contains 300 grams of Colombian beans, 50 grams of Kenyan beans, and 150 grams of French roast beans and the gourmet blend contains 100 grams of Colombian beans, 350 grams of Kenyan beans, and 50 grams of French roast beans. This time the merchant has on hand 30 kilograms of Colombian beans, 15 kilograms of Kenyan beans, and 15 kilograms of French roast beans. Suppose one bag of the house blend produces a profit of $0.50, one bag of the special blend produces a profit of $1.50, and one bag of the gourmet blend produces a profit of $2.00. How many bags of each type should the merchant prepare if he wants to use up all of the beans and maximize his profit? What is the maximum profit?arrow_forwardSuppose the demand equation is: Q= 80 - 1.25p. What is the price elasticity of demand if the price is $40 per unt and output is 30 unites? The price elasticity of demand is-1.67. (Enter a numeric response using a real number rounded to twe decimal placss) This means that if the price increases by B%, the quantity demanded will (Enter a numeric response using a real number rounded to two decimal places.) decrease increasearrow_forwardLast year OHaganBooks.com experimented with an online subscriber service, Red On Line (ROL), for its e-book service. The consumer demand for ROL was modeled by the equation q = 900e−p2 + p, where p was the monthly access charge and q is the number of subscribers. (a)Obtain a formula for the price elasticity of demand, E, for ROL services. E(p) = _____ (b)Compute the elasticity of demand if the monthly access charge is set at $2 per month. E(2) = _____ (c)How much (in dollars) should the company have charged to obtain the maximum monthly revenue? $ _____ How much (in dollars) would this revenue have been? $ ______arrow_forward
arrow_back_ios
arrow_forward_ios
Recommended textbooks for you
- Algebra & Trigonometry with Analytic GeometryAlgebraISBN:9781133382119Author:SwokowskiPublisher:Cengage
 Algebra and Trigonometry (MindTap Course List)AlgebraISBN:9781305071742Author:James Stewart, Lothar Redlin, Saleem WatsonPublisher:Cengage Learning
 Linear Algebra: A Modern IntroductionAlgebraISBN:9781285463247Author:David PoolePublisher:Cengage Learning
Algebra & Trigonometry with Analytic Geometry
Algebra
ISBN:9781133382119
Author:Swokowski
Publisher:Cengage
Algebra and Trigonometry (MindTap Course List)
Algebra
ISBN:9781305071742
Author:James Stewart, Lothar Redlin, Saleem Watson
Publisher:Cengage Learning
Linear Algebra: A Modern Introduction
Algebra
ISBN:9781285463247
Author:David Poole
Publisher:Cengage Learning