MATLAB: An Introduction with Applications
6th Edition
ISBN: 9781119256830
Author: Amos Gilat
Publisher: John Wiley & Sons Inc
expand_more
expand_more
format_list_bulleted
Question

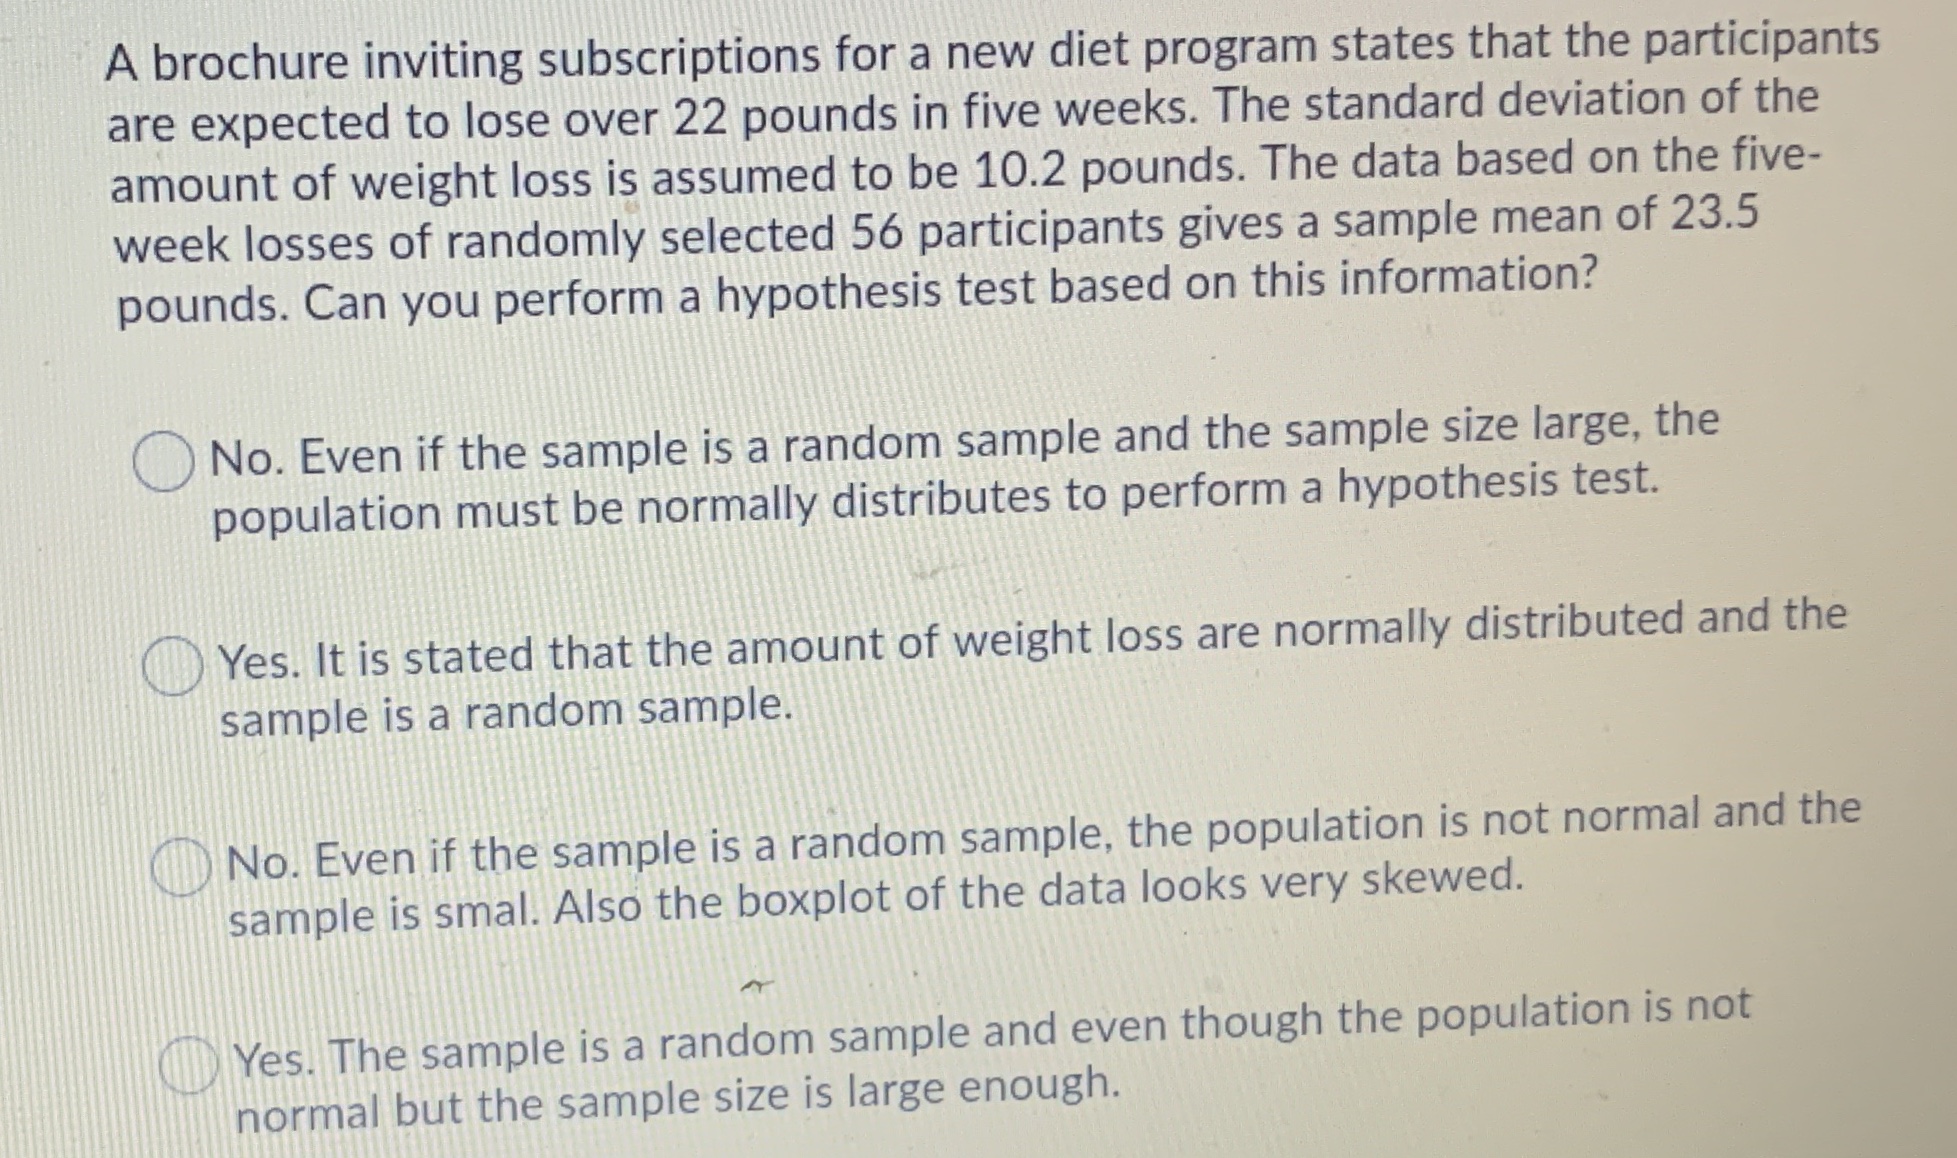
Transcribed Image Text:A brochure inviting subscriptions for a new diet program states that the participants
are expected to lose over 22 pounds in five weeks. The standard deviation of the
amount of weight loss is assumed to be 10.2 pounds. The data based on the five-
week losses of randomly selected 56 participants gives a sample mean of 23.5
pounds. Can you perform a hypothesis test based on this information?
O No. Even if the sample is a random sample and the sample size large, the
population must be normally distributes to perform a hypothesis test.
O Yes. It is stated that the amount of weight loss are normally distributed and the
sample is a random sample.
No. Even if the sample is a random sample, the population is not normal and the
sample is smal. Also the boxplot of the data looks very skewed.
O Yes. The sample is a random sample and even though the population is not
normal but the sample size is large enough.

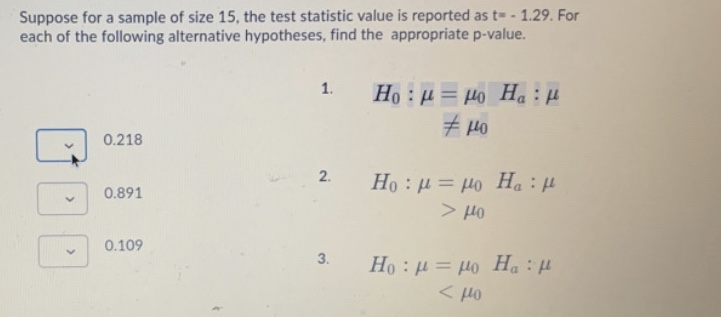
Transcribed Image Text:Suppose for a sample of size 15, the test statistic value is reported as t= - 1.29. For
each of the following alternative hypotheses, find the appropriate p-value.
Ho : µ = µo Ha :H
1.
Ho Ha: u
0.218
2.
0.891
> Ho
: "H Of — тl: OH
0.109
3.
Но : и — до Н, : и
Expert Solution
This question has been solved!
Explore an expertly crafted, step-by-step solution for a thorough understanding of key concepts.
This is a popular solution
Trending nowThis is a popular solution!
Step by stepSolved in 2 steps with 3 images

Knowledge Booster
Similar questions
- In a recent year, 11th grade New York public school students taking an English test produced test scores that were normally distributed with a mean of 84 and a standard deviation of 7.2. Let x be a random variable that represents a test score. What is the lowest score that would still place a student in the top 30% of the scores? A. 85.82 B. 87.78 C. 82.52 D. 79.47arrow_forwardAfter the political ad campaign, pollsters check the mayor's positives. They test the hypothesis that the ads produced no change against the alternative that the positives are now above 47% and find a P-value of 0.283. Which conclusion is appropriate? Explain. Choose the correct answer below. O A. There is a 28.3% chance that natural sampling variation could produce poll results at least as far above 47% as these if there is really no change in public opinion. There is a 28.3% chance that the poll they conducted is correct. O B. O C. There is a 71.7% chance that the ads worked. O D. There is a 28.3% chance that the ads worked.arrow_forwardYou work for a soft-drink company in the quality control division. You are interested in the variance of one of your production lines as a measure of consistency. The product is intended to have a mean of 12 ounces, and your team would like the variance to be as low as possible. You gather a random sample of 16 containers. Estimate the population variance at a 80% level of confidence. 11.82 11.83 11.85 11.89 11.9 11.97 12 12 12 12.01 12.02 12.04 12.05 12.11 12.16 12.18 Variance of Data: 0.012 Note: Round all values to 3 decimals and use those rounded values in subsequent calculations. a) Find the lower and upper x critical values at 80% confidence: Lower: Upper: b) Report your confidence interval for o?: Lower Bound: Upper Bound:arrow_forward
- Assume that the two samples are independent simple random samples selected from normally distributed populations. Do not assume that the population standard deviations are equal. A researcher was interested in comparing the GPAs of students at two different colleges. Independent simple random samples of 8 students from college A and 13 students from college B yielded the following GPAs. College A 3.7 3.2 3.0 2.5 2.7 3.6 2.8 3.4 College B 3.8 3.2 3.0 3.9 3.8 2.5 3.9 2.8 4.0 3.6 2.6 4.0 3.6 Construct a 95% confidence interval for μ1−μ2, the difference between the mean GPA of college A students and the mean GPA of college B students. Round to two decimal places. (Note: x1=3.1125, x2=3.4385, s1=0.4357 s2=0.5485arrow_forwardA researcher would like to evaluate the effectiveness of a pain-relief patch designed for lower back pain. Prior to testing the patch, each of n = 8 patients rates the current level of back pain on a scale from 1 to 10. After wearing the patch for 90 minutes, a second pain rating is recorded. The data are as follows: Include in your responses: A. Compute the mean and variance for the sample of difference scores. B. Provide the Null and alternative hypotheses C. Calculate SSDarrow_forwardKurtis is a statistician who claims that the average salary of an employee in the city of Yarmouth is no more than $55,000 per year. Gina, his colleague, believes this to be incorrect, so she randomly selects 61 employees who work in Yarmouth and record their annual salary. Gina calculates the sample mean income to be $56,500 per year with a sample standard deviation of 3,750. Using the alternative hypothesis H1 : 55.0 appropriate hypothesis test. Round the test statistic to two decimal places and the p-value to three decimal places. Right-Tailed T-Table probability Degrees of Freedom 54 0.00040.00140.00240.00340.00440.00540.0064 56 57 58 59 60 3.562 3.135 2.943 2.816 2.719 2.641 2.576 3.558 3.132 2.941 2.814 2.7172.640 2.574 3.554 3.130 2.939 2.8122.716 2.638 2.572 3.550 3.127 2.937 2.810 2.714 2.636 2.571 3.547 3.125 2.935 2.8082.712 2.635 2.569 3.544 3.122 2.933 2.806 2.711 2.633 2.568 3.540 3.120 2.931 2.805 2.709 2.632 2.567 Provide your answer below , p-value -arrow_forward
- Use the random sample data to test the claim that the mean travel distance to work in California is less than 35 miles. Use 1% level of significance. Sample data: x¯=32.4 mi s=8.3 mi n=35 Identify the tail of the test. Find the P-value Will the null hypothesis be rejected? Is the initial claim supported?arrow_forwardAn article in a Journal reports that 34% of American fathers take no responsibility for childcare. A researcher claims that the figure is higher for fathers in the town of Littleton. A random sample of 234 fathers from Littleton yielded 96 who did not help with childcare. How many populations? 01 What is the parameter? O Mean O Proportion O Difference between Means O Variance Standard Deviationarrow_forwardA large sample size is needed to show significance in a test of two population standard deviation. O True O Falsearrow_forward
arrow_back_ios
arrow_forward_ios
Recommended textbooks for you
 MATLAB: An Introduction with ApplicationsStatisticsISBN:9781119256830Author:Amos GilatPublisher:John Wiley & Sons Inc
 Probability and Statistics for Engineering and th...StatisticsISBN:9781305251809Author:Jay L. DevorePublisher:Cengage Learning
 Statistics for The Behavioral Sciences (MindTap C...StatisticsISBN:9781305504912Author:Frederick J Gravetter, Larry B. WallnauPublisher:Cengage Learning
 Elementary Statistics: Picturing the World (7th E...StatisticsISBN:9780134683416Author:Ron Larson, Betsy FarberPublisher:PEARSON
 The Basic Practice of StatisticsStatisticsISBN:9781319042578Author:David S. Moore, William I. Notz, Michael A. FlignerPublisher:W. H. Freeman
 Introduction to the Practice of StatisticsStatisticsISBN:9781319013387Author:David S. Moore, George P. McCabe, Bruce A. CraigPublisher:W. H. Freeman

MATLAB: An Introduction with Applications
Statistics
ISBN:9781119256830
Author:Amos Gilat
Publisher:John Wiley & Sons Inc

Probability and Statistics for Engineering and th...
Statistics
ISBN:9781305251809
Author:Jay L. Devore
Publisher:Cengage Learning

Statistics for The Behavioral Sciences (MindTap C...
Statistics
ISBN:9781305504912
Author:Frederick J Gravetter, Larry B. Wallnau
Publisher:Cengage Learning

Elementary Statistics: Picturing the World (7th E...
Statistics
ISBN:9780134683416
Author:Ron Larson, Betsy Farber
Publisher:PEARSON

The Basic Practice of Statistics
Statistics
ISBN:9781319042578
Author:David S. Moore, William I. Notz, Michael A. Fligner
Publisher:W. H. Freeman

Introduction to the Practice of Statistics
Statistics
ISBN:9781319013387
Author:David S. Moore, George P. McCabe, Bruce A. Craig
Publisher:W. H. Freeman