
MATLAB: An Introduction with Applications
6th Edition
ISBN: 9781119256830
Author: Amos Gilat
Publisher: John Wiley & Sons Inc
expand_more
expand_more
format_list_bulleted
Related questions
Question
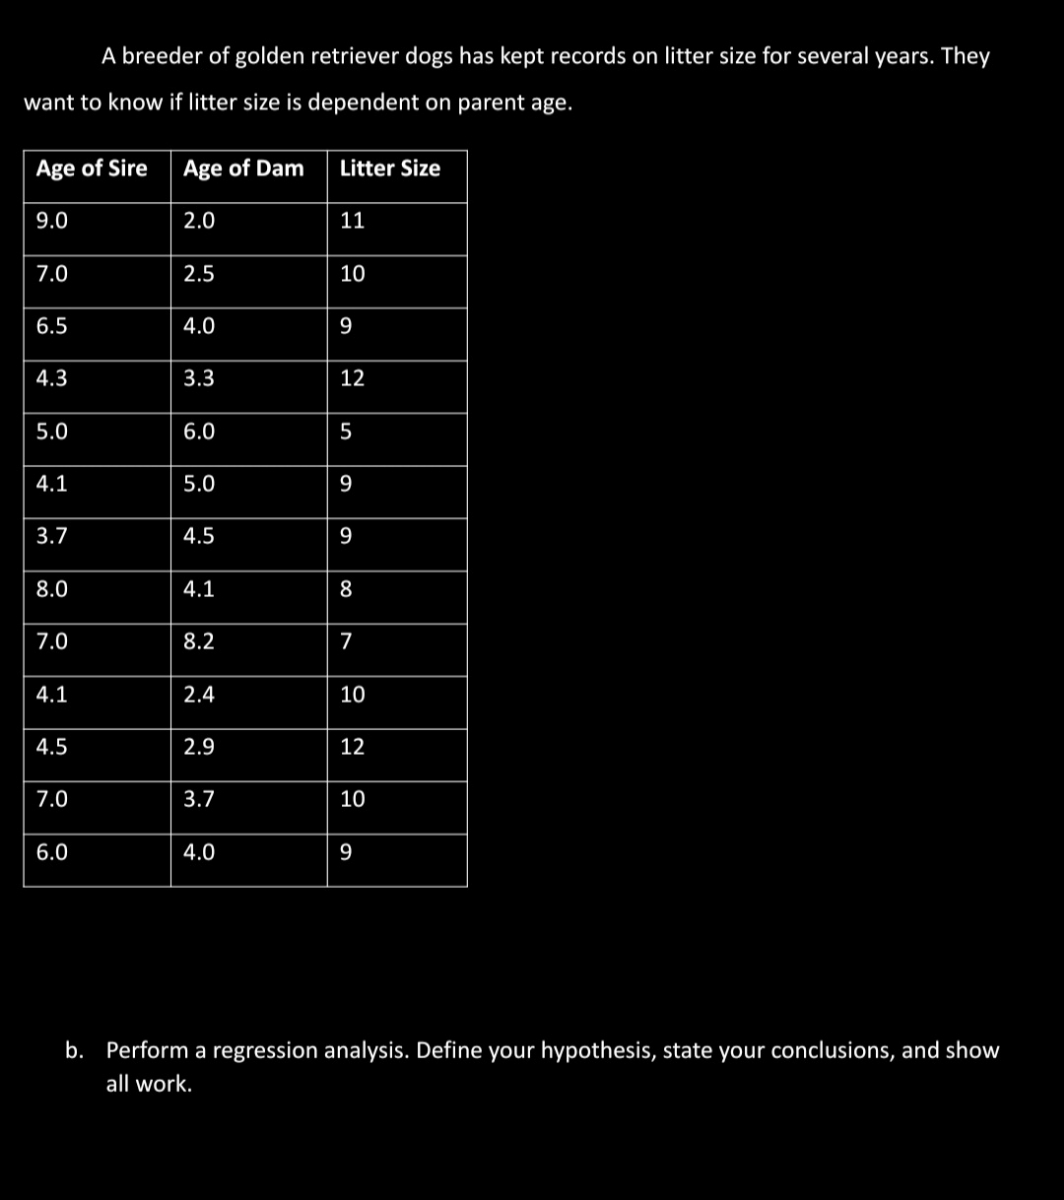

Transcribed Image Text:A breeder of golden retriever dogs has kept records on litter size for several years. They
want to know if litter size is dependent on parent age.
Age of Sire
9.0
7.0
6.5
4.3
5.0
4.1
3.7
8.0
7.0
4.1
4.5
7.0
6.0
Age of Dam
2.0
2.5
4.0
3.3
6.0
5.0
4.5
4.1
8.2
2.4
2.9
3.7
4.0
Litter Size
11
10
9
12
5
9
9
8
7
10
12
10
9
b. Perform a regression analysis. Define your hypothesis, state your conclusions, and show
all work.
Expert Solution
This question has been solved!
Explore an expertly crafted, step-by-step solution for a thorough understanding of key concepts.

This is a popular solution

Trending nowThis is a popular solution!

Step by stepSolved in 3 steps with 18 images

Knowledge Booster

Similar questions
- Blue 0.143 Freckles 0.030 eyes No Freckles 0.857 0.182 Black 0.047 Green hair eyes 0.818 0.018 0.923 Brown eyes 0.982 0.278 0.061 Blue 0.259 eyes 0.722 0.232 Brown 0.327 Green hair eyes 0.768 0.153 Brown 0.461 0.414 eyes Caucasian 0.847 child 0.319 Blue 0.562 0.453 eyes 0.681 0.315 Green 0.302 Blonde hair eyes 0.698 0.164 Brown 0.123 eyes 0.025 0.836 0.857 Blue 0.473 eyes 0.143 0.767 Green Red hair 0.405 eyes 0.233 0.778 Brown 0.122 eyes 0.222arrow_forwardSome data is intentionally missing. By hand or R-Studio is fine Thanks in advance! DeCaf Caf 1 11.5 3.3 2 0.2 4.8 3 4 10.6 4 6.7 8.3 5 13.4 5.7 6 16.1 3.2 7 14.1 6.8 8 10.3 5.9 9 6.9 5.2 10 6.7 9.4 11 4.1 8.8 12 7.6 12.7 13 6.5 1.1 14 11.4 8.6 15 5.1 11.1 16 10 9.9 17 6.7 6.3 18 6.8 8.5 19 1.4 9.5 20 2.4 6.2 21 2.7 10.6 22 3.1 5.6 23 2.6 3 24 4.5 12.9 25 0.6 8.3 26 4.4 27 0.2 28 0.7 29 4.5 30 5.1 31 12.2 32 3.6 33 3 34 10.3 35 36 37 38 39 40 41 42 43 44 45 46 47 48 49 50 51 52…arrow_forwardAnother type of painted ceramic vessel is called three-circle red-on-white ( Mimbres Mogollon Archaeology). At four different sites in the Wind Mountain archaeological region, the number of such sherds was counted in local dwelling excavations. Site I Site II Site III Site IV 15 13 38 15 22 2 20 21 4 31 15 13 15 7 44 34 17 23 12 11 12 Shall we reject or not reject the claim that there is no difference in the population mean three-circle red-on-white sherd counts for the four sites? Use a 5% level of significance. (a) What is the level of significance? (b) Find SSTOT, SSBET, and SSW and check that SSTOT = SSBET + SSW. (Use 3 decimal places.) SSTOT = SSBET = SSW = Find d.f.BET, d.f.W, MSBET, and MSW. (Use 3 decimal places for MSBET, and MSW.) dfBET = dfW = MSBET = MSW = Find the value of the sample F statistic. (Use 3 decimal places.)What are the degrees of freedom??(numerator)?(denominator)(c) Find the P-value of the sample…arrow_forward
- I. Chi Diana Vasqu Tim 5 of 9 (4 complete) ▼ i Data Table when stop bet 0.718 1.440 1.943 2.447 3.143 3.707 7 0.711 1.415 1.895 2.365 2.998 3.499 0.706 1.397 1.860 2.306 2.896 3.355 0.703 1.383 1.833 2.262 2.821 3.250 2.228 2.764 2.718 10 0.700 1.372 1.812 3.169 11 0.697 1.363 1.796 2.201 3.106 3.055 3.012 12 0.695 1.356 1.782 2.179 2.681 13 0.694 1.350 1.771 2.160 2.650 14 0.692 1.345 1.761 2.145 2.624 2.977 15 0.691 1.341 1.753 2.131 2.602 2.947 16 0.690 1.337 1.746 2.120 2.583 2.921. within your c 17 0.689 1.333 1.740 2.110 2.567 2.898 18 0.688 1.330 1.734 2.101 2.552 2.878 19 0.688 1.328 1.729 2.093 2.539 2.861 20 0.687 1.325 1.725 2.086 2.528 2.845 21 0.686 1.323 1.721 2.080 2.518 2.831 22 0.686 1.321 1.717 2.074 2.508 2.819 23 0.685 1.319 1.714 2.069 2.500 2.807 2.492 2.485 24 0.685 1.318 1.711 2.064 2.797 25 0.684 1.316 1.708 2.060 2.787 26 0.684 1.315 1.706 2.056 2.479 2.779 2.473 2.467 2.462 2.326 27 0.684 1.314 1.703 2.052 2.771 28 0.683 1.313 1.701 2.048 2.763 a signif 1.311…arrow_forwardRead the following prompt and complete 3.a and 3.barrow_forwardWe asked UST employees to tell us how many megabytes of memory (RAM) they have on their computer. WWe would like to test to see if the mean amount of memory is the same for three different academic departments. We have the memory amounts for six faculty members' machines in the three departments shown below. Dept. 1 Dept. 2 Dept. 3 1 2048 4096 4096 2 2048 2048 4096 3. 2048 2048 8192 computer 4 2048 4096 8192 2048 2048 4096 6. 2048 8192 4096 Here is the ANOVA table: Analysis of Variance Source DF Adj SS Adj MS F-Value P-Value Factor 34952533 17476267 XXX 0.020 Error XX 51030699 3402047 Total XX 85983232 Calculate the value of the F test statistic and enter here:arrow_forward
- My electric bills for June, July, and August last summer were $75, $75, and $150, respectively. What was the mean amount for the three bills? Question 14 options: $75 $100 $125 $150arrow_forwardWe asked UST employees to tell us how many megabytes of memory (RAM) they have on their computer. We would like to test to see if the mean amount of memory is the same for three different academic departments. We have the memory amounts for six faculty members' machines in the three departments shown below. Dept. 1 Dept. 2 Dept. 3 1 2048 4096 4096 2 1024 2048 4096 3 1024 2048 8192 computer 4 2048 4096 8192 5 1024 2048 4096 6 2048 8192 2048 Here is the ANOVA table: Source DF Adj SS Adj MS F-Value P-Value Factor x 39263346 19631673 x.xx 0.025 Error xx 61691221 4112748 Total xx…arrow_forwardThe following data represents the age of 30 lottery winners. 21 49 54 63 54 35 52 45 88 65 64 51 41 34 49 78 31 40 51 70 78 60 74 55 29 66 59 32 68 56 Complete the frequency distribution for the data. Bin Frequency 20-29 30-39 40-49 50-59 60-69 70-79 80-89arrow_forward
- We asked UST employees to tell us how many megabytes of memory (RAM) they have on their computer. We would like to test to see if the mean amount of memory is the same for three different academic departments. We have the memory amounts for six faculty members' machines in the three departments shown below. Dept. 1 Dept. 2 Dept. 3 1 4096 4096 4096 2 4096 2048 4096 4096 2048 8192 computer 4 8192 4096 8192 4096 2048 4096 6. 2048 8192 2048 Here is the ANOVA table: Analysis of Variance Source DF Adj SS Adj MS F-Value P-Value Factor 5592405 2796203 XXX 0.604 Error XX 80390827 5359388 Total XX 85983232 Calculate the number of degrees of freedom Error. 3.arrow_forwardWe asked UST employees to tell us how many megabytes of memory (RAM) they have on their computer. We would like to test to see if the mean amount of memory is the same for three different academic departments. We have the memory amounts for six faculty members' machines in the three departments shown below. Dept. 1 Dept. 2 Dept.3 1 2048 4096 4096 1024 2048 4096 3. 1024 2048 8192 computer 4 2048 4096 8192 1024 2048 4096 2048 8192 2048 Here is the ANOVA table: Source DF Adj SS Adj MS F-Value P-Value Factor x 39263346 19631673 x.xX 0.025 Error xx 61691221 4112748 Total XX 100954567 After ANOVA, assume that we want to do all of the pairwise comparisons between the means in this case. Tukey Pairwise Comparisons: Grouping Information Using the Tukey Method andarrow_forwardThe personnel files of all eight employees at the Pawnee location of Acme Carpet Cleaners Inc. revealed that during the last 6-month period they lost the following number of days due to illness: 5 5 4 4 1 2 All eight employees during the same period at the Chickpee location of Acme Carpets revealed they lost the following number of days due to illness: Range Mean 2 1 0 10 2 2 3 0 0 6 Click here for the Excel Data File Required: a. Calculate the range and mean for the Pawnee location and the Chickpee location. (Round the "Mean" to 2 decimal places.) Pawnee location O Chickpee location O Pawnee location Chickpee location b-1. Based on the data which location has fewer lost days?arrow_forward
arrow_back_ios
SEE MORE QUESTIONS
arrow_forward_ios
Recommended textbooks for you
- MATLAB: An Introduction with ApplicationsStatisticsISBN:9781119256830Author:Amos GilatPublisher:John Wiley & Sons Inc
 Probability and Statistics for Engineering and th...StatisticsISBN:9781305251809Author:Jay L. DevorePublisher:Cengage Learning
 Statistics for The Behavioral Sciences (MindTap C...StatisticsISBN:9781305504912Author:Frederick J Gravetter, Larry B. WallnauPublisher:Cengage Learning
  Elementary Statistics: Picturing the World (7th E...StatisticsISBN:9780134683416Author:Ron Larson, Betsy FarberPublisher:PEARSON
 The Basic Practice of StatisticsStatisticsISBN:9781319042578Author:David S. Moore, William I. Notz, Michael A. FlignerPublisher:W. H. Freeman
 Introduction to the Practice of StatisticsStatisticsISBN:9781319013387Author:David S. Moore, George P. McCabe, Bruce A. CraigPublisher:W. H. Freeman
MATLAB: An Introduction with Applications
Statistics
ISBN:9781119256830
Author:Amos Gilat
Publisher:John Wiley & Sons Inc
Probability and Statistics for Engineering and th...
Statistics
ISBN:9781305251809
Author:Jay L. Devore
Publisher:Cengage Learning
Statistics for The Behavioral Sciences (MindTap C...
Statistics
ISBN:9781305504912
Author:Frederick J Gravetter, Larry B. Wallnau
Publisher:Cengage Learning
Elementary Statistics: Picturing the World (7th E...
Statistics
ISBN:9780134683416
Author:Ron Larson, Betsy Farber
Publisher:PEARSON
The Basic Practice of Statistics
Statistics
ISBN:9781319042578
Author:David S. Moore, William I. Notz, Michael A. Fligner
Publisher:W. H. Freeman
Introduction to the Practice of Statistics
Statistics
ISBN:9781319013387
Author:David S. Moore, George P. McCabe, Bruce A. Craig
Publisher:W. H. Freeman