MATLAB: An Introduction with Applications
6th Edition
ISBN: 9781119256830
Author: Amos Gilat
Publisher: John Wiley & Sons Inc
expand_more
expand_more
format_list_bulleted
Question

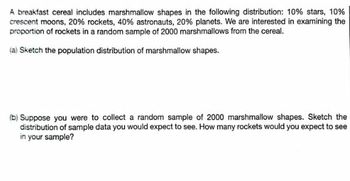
Transcribed Image Text:A breakfast cereal includes marshmallow shapes in the following distribution: 10% stars, 10%
crescent moons, 20% rockets, 40% astronauts, 20% planets. We are interested in examining the
proportion of rockets in a random sample of 2000 marshmallows from the cereal.
(a) Sketch the population distribution of marshmallow shapes.
(b) Suppose you were to collect a random sample of 2000 marshmallow shapes. Sketch the
distribution of sample data you would expect to see. How many rockets would you expect to see
in your sample?
Expert Solution
This question has been solved!
Explore an expertly crafted, step-by-step solution for a thorough understanding of key concepts.
This is a popular solution
Trending nowThis is a popular solution!
Step by stepSolved in 2 steps with 2 images

Knowledge Booster
Similar questions
- In the US, 43.9% of all people have type O blood, 40.6% have type A blood, 10.8% have type B blood and 4.7% have type AB blood. A researcher wants to see if the distribution of blood type is different for millionaires. The table below shows the results of a random sample of 3488 millionaires. What can be concluded at the a = 0.05 significance level? a. Complete the table by filling in the expected frequencies. Round to the nearest whole number: Frequencies of Blood Type Outcome Frequency Expected Frequency 1521 A 1427 В 376 АВ 164arrow_forwardAnswer the following questions using the separate rates X1,..., X20 and Y1,..., Y20 shown in Figure 1. (a) Carry out the calculations for a test of the hypotheses that the mean U.S. mortality rate On remained the same or increased from 2005 to 2015 against the alternative that the mean mortality rate decreased. State the hypotheses, test statistic, rejection region, and p-value. Do not interpret the conclusion of the test. (b) Compute a 99% confidence interval for the change in mean heart rate mortality. Do not interpret the interval.arrow_forwardConsumer Reports rated automobile insurance companies and gave annual premiums for top-rated companies in several states. The figure below shows premiums for urban customers (married couple with one 17-year-old son) in three states. The box plots were all drawn using the same scale on a TI-8- Texas Pennsylvania California (a) Which state has the lowest premium? the highest? O lowest, California; highest, Texas O lowest, Texas; highest, Pennsylvania O lowest, Pennsylvania; highest, California lowest, California; highest, Pennsylvaniaarrow_forward
- You may need to use the appropriate technology to answer this question. During the first 13 weeks of the television season, the Saturday evening 8:00 p.m. to 9:00 p.m. audience proportions were recorded as ABC 31%, CBS 26%, NBC 27%, and independents 16%. A sample of 300 homes two weeks after a Saturday night schedule revision yielded the following viewing audience data: ABC 97 homes, CBS 68 homes, NBC 91 homes, and independents 44 homes. Test with a = 0.05 to determine whether the viewing audience proportions changed. State the null and alternative hypotheses. 0.31, PCBS = 0.26, PNBC = 0.27, PIND 0.27, PIND = 0.16. Ho: : The proportions are not pPABC Наi РАВС 3 0.31, РсвS 0.26, PNBC 0.16 0.27, 0.16 Но: РАВС 0.31, Рсвs 3D 0.26, Наi РАВС + 0.31, РсвS PNBC + 0.26, PNBC ± 0.27, , PIND + 0.16 Ho: PABC + 0.31, PCBS + 0.26, PNBC + 0.27, PIND + 0.16 0.26, PNBC 0.27, PIND = 0.16 %D На РАВС - 0.31, РсBs 0.26, PNBC 0.27, PIND 0.16 Нo: РАВС - 0.31, РсBS H: The proportions are not PABC 0.16. 0.31,…arrow_forward(#15) please helparrow_forward
arrow_back_ios
arrow_forward_ios
Recommended textbooks for you
 MATLAB: An Introduction with ApplicationsStatisticsISBN:9781119256830Author:Amos GilatPublisher:John Wiley & Sons Inc
 Probability and Statistics for Engineering and th...StatisticsISBN:9781305251809Author:Jay L. DevorePublisher:Cengage Learning
 Statistics for The Behavioral Sciences (MindTap C...StatisticsISBN:9781305504912Author:Frederick J Gravetter, Larry B. WallnauPublisher:Cengage Learning
 Elementary Statistics: Picturing the World (7th E...StatisticsISBN:9780134683416Author:Ron Larson, Betsy FarberPublisher:PEARSON
 The Basic Practice of StatisticsStatisticsISBN:9781319042578Author:David S. Moore, William I. Notz, Michael A. FlignerPublisher:W. H. Freeman
 Introduction to the Practice of StatisticsStatisticsISBN:9781319013387Author:David S. Moore, George P. McCabe, Bruce A. CraigPublisher:W. H. Freeman

MATLAB: An Introduction with Applications
Statistics
ISBN:9781119256830
Author:Amos Gilat
Publisher:John Wiley & Sons Inc

Probability and Statistics for Engineering and th...
Statistics
ISBN:9781305251809
Author:Jay L. Devore
Publisher:Cengage Learning

Statistics for The Behavioral Sciences (MindTap C...
Statistics
ISBN:9781305504912
Author:Frederick J Gravetter, Larry B. Wallnau
Publisher:Cengage Learning

Elementary Statistics: Picturing the World (7th E...
Statistics
ISBN:9780134683416
Author:Ron Larson, Betsy Farber
Publisher:PEARSON

The Basic Practice of Statistics
Statistics
ISBN:9781319042578
Author:David S. Moore, William I. Notz, Michael A. Fligner
Publisher:W. H. Freeman

Introduction to the Practice of Statistics
Statistics
ISBN:9781319013387
Author:David S. Moore, George P. McCabe, Bruce A. Craig
Publisher:W. H. Freeman