
MATLAB: An Introduction with Applications
6th Edition
ISBN: 9781119256830
Author: Amos Gilat
Publisher: John Wiley & Sons Inc
expand_more
expand_more
format_list_bulleted
Related questions
Question
also help finding
- lower bount
- upper bound
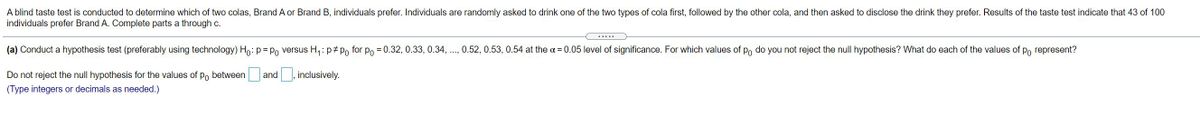

Transcribed Image Text:A blind taste test is conducted to determine which of two colas, Brand A or Brand B, individuals prefer. Individuals are randomly asked to drink one of the two types of cola first, followed by the other cola, and then asked to disclose the drink they prefer. Results of the taste test indicate that 43 of 100
individuals prefer Brand A. Complete parts a through c.
.....
(a) Conduct a hypothesis test (preferably using technology) Ho: p= Po versus H,: p#P, for po = 0.32, 0.33, 0.34, ., 0.52, 0.53, 0.54 at the a = 0.05 level of significance. For which values of po do you not reject the null hypothesis? What do each of the values of po represent?
and , inclusively.
Do not reject the null hypothesis for the values of po between
(Type integers or decimals as needed.)
Expert Solution
This question has been solved!
Explore an expertly crafted, step-by-step solution for a thorough understanding of key concepts.

This is a popular solution

Trending nowThis is a popular solution!

Step by stepSolved in 3 steps with 2 images

Knowledge Booster

Similar questions
- Please don't copy Using XTWX for information matrix show the variance of the MLE of beta in logistic regression is 1/a +1/b+1/c+1/d where outcome no outcome exp a b not exp c darrow_forwardEstimate the average gasoline consumption over the time interval [0,5].Estimate the average gasoline consumption over the time interval [7,10]arrow_forwardcall: Researchers measured the percent 1m(formula = Symptoms - wear_mask, data - some_states) of people in 25 states who ʻknew someone with COVID symptoms' (ŷ) and regressed this on the percent of the population frequently wearing a mask in public (x). Residuals: Min -7.9167 -2.3306 -0.2469 2.5020 7. 3345 10 Median 30 Маx coefficients: (Intercept) 111.0981 wear_mask Estimate std. Error t value Pr (>|t|) 10. 5423 10. 538 2.82e-10 *** -8. 375 1. 94 e-08 *** -1.0419 0.1244 signif. codes: 0 ****' 0.001 ***' 0.01 **' 0.05 '.' 0.1 ' ' 1 Residual standard error: 3.859 on 23 degrees of freedom Multiple R-squared: 0.7531, F-statistic: 70.15 on 1 and 23 DF, p-value: 1.936e-08 Adjusted R-squared: 0.7423 If 75 percent of people in a state wear masks regularly, what % of people does this model predict will know someone with COVID symptons? 1) 32 2) 33 3) 34 4) 35arrow_forward
- Please answer as many as your allowed too. Thank you :) A regression was run to determine if there is a relationship between the happiness index (y) and life expectancy in years of a given country (x).The results of the regression were: ˆyy^=a+bxa=-1.68b=0.168 (a) Write the equation of the Least Squares Regression line of the formˆyy^= + x(b) Which is a possible value for the correlation coefficient, rr? -1.417 1.417 0.702 -0.702 (c) If a country increases its life expectancy, the happiness index will increase decrease (d) If the life expectancy is increased by 0.5 years in a certain country, how much will the happiness index change? Round to two decimal places.(e) Use the regression line to predict the happiness index of a country with a life expectancy of 69 years. Round to two decimal places.arrow_forwardThe question is asking for the frequency of a-f and f(x) of a-f scores on the imagearrow_forwardFind the regression line round all decimals to 4 decimal places (5,5)(7,7)(8,9)arrow_forward
- I am completely lost please helparrow_forwardWhich method gives a unique set of values to the constants in the equation of the fitting curves? * Newton's Method Interpolation Horner’s method Method of least squaresarrow_forwardWhen a least squares line is fit to the 11 observations in the service time data, we obtain SSE= 210.8204. Calculate s? and s. (Round s2 to 4 decimal places. Round s to 5 decimal places.) s^2 This is a numeric cell, so please enter numbers only.arrow_forward
arrow_back_ios
SEE MORE QUESTIONS
arrow_forward_ios
Recommended textbooks for you
- MATLAB: An Introduction with ApplicationsStatisticsISBN:9781119256830Author:Amos GilatPublisher:John Wiley & Sons Inc
 Probability and Statistics for Engineering and th...StatisticsISBN:9781305251809Author:Jay L. DevorePublisher:Cengage Learning
 Statistics for The Behavioral Sciences (MindTap C...StatisticsISBN:9781305504912Author:Frederick J Gravetter, Larry B. WallnauPublisher:Cengage Learning
  Elementary Statistics: Picturing the World (7th E...StatisticsISBN:9780134683416Author:Ron Larson, Betsy FarberPublisher:PEARSON
 The Basic Practice of StatisticsStatisticsISBN:9781319042578Author:David S. Moore, William I. Notz, Michael A. FlignerPublisher:W. H. Freeman
 Introduction to the Practice of StatisticsStatisticsISBN:9781319013387Author:David S. Moore, George P. McCabe, Bruce A. CraigPublisher:W. H. Freeman
MATLAB: An Introduction with Applications
Statistics
ISBN:9781119256830
Author:Amos Gilat
Publisher:John Wiley & Sons Inc
Probability and Statistics for Engineering and th...
Statistics
ISBN:9781305251809
Author:Jay L. Devore
Publisher:Cengage Learning
Statistics for The Behavioral Sciences (MindTap C...
Statistics
ISBN:9781305504912
Author:Frederick J Gravetter, Larry B. Wallnau
Publisher:Cengage Learning
Elementary Statistics: Picturing the World (7th E...
Statistics
ISBN:9780134683416
Author:Ron Larson, Betsy Farber
Publisher:PEARSON
The Basic Practice of Statistics
Statistics
ISBN:9781319042578
Author:David S. Moore, William I. Notz, Michael A. Fligner
Publisher:W. H. Freeman
Introduction to the Practice of Statistics
Statistics
ISBN:9781319013387
Author:David S. Moore, George P. McCabe, Bruce A. Craig
Publisher:W. H. Freeman