
MATLAB: An Introduction with Applications
6th Edition
ISBN: 9781119256830
Author: Amos Gilat
Publisher: John Wiley & Sons Inc
expand_more
expand_more
format_list_bulleted
Related questions
Concept explainers
Question
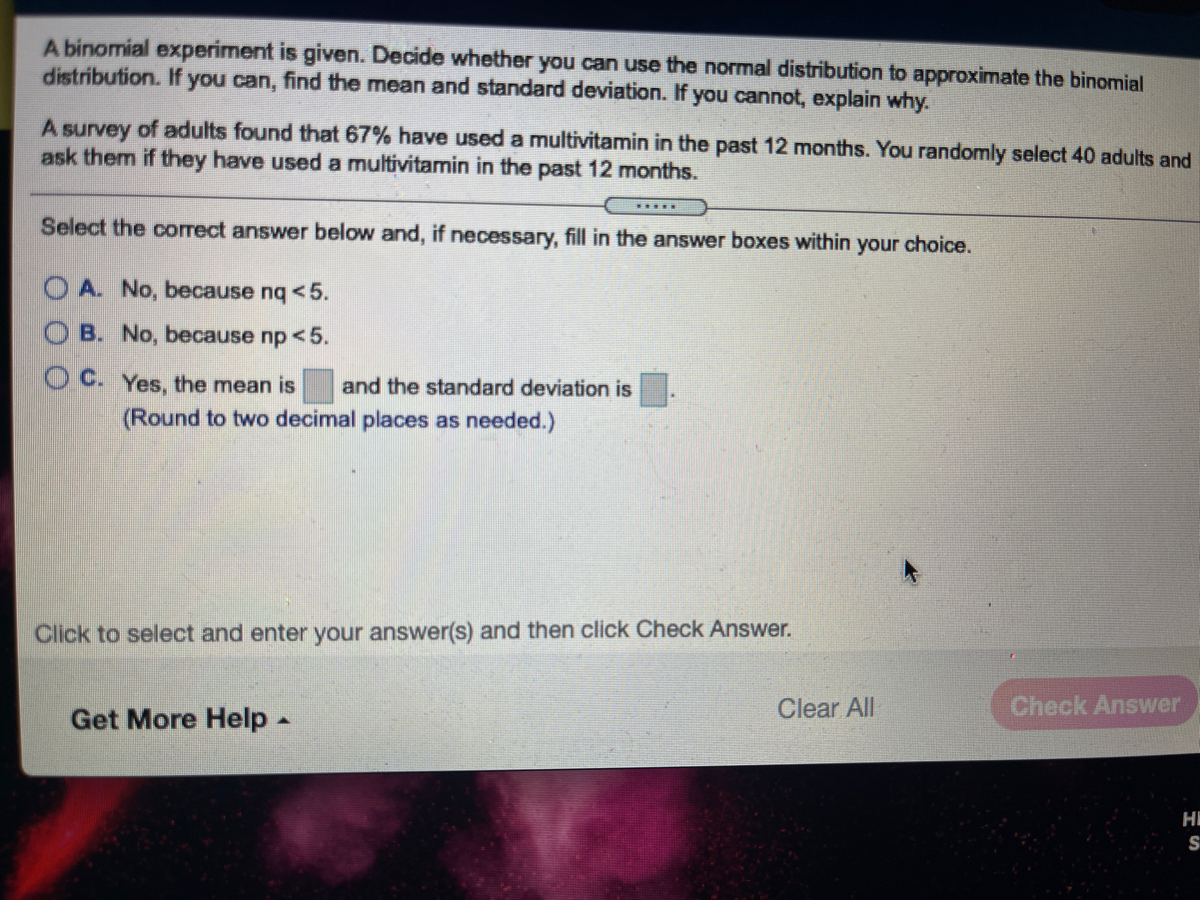

Transcribed Image Text:A binomial experiment is given. Decide whether you can use the normal distribution to approximate the binomial
distribution. If you can, find the mean and standard deviation. If you cannot, explain why.
A survey of adults found that 67% have used a multivitamin in the past 12 months. You randomly select 40 adults and
ask them if they have used a multivitamin in the past 12 months.
Select the correct answer below and, if necessary, fill in the answer boxes within your choice.
OA. No, because nq <5.
B. No, because np <5.
O C. Yes, the mean is
and the standard deviation is
(Round to two decimal places as needed.)
Click to select and enter your answer(s) and then click Check Answer.
Get More Help-
Clear All
Check Answer
HI
S
Expert Solution
This question has been solved!
Explore an expertly crafted, step-by-step solution for a thorough understanding of key concepts.

Step by stepSolved in 2 steps with 1 images

Knowledge Booster


Learn more about
Need a deep-dive on the concept behind this application? Look no further. Learn more about this topic, statistics and related others by exploring similar questions and additional content below.Similar questions
- A binomial experiment is given. Decide whether you can use the normal distribution to approximate the binomial distribution. If you can, find the mean and standard deviation. If you cannot, explain why. A survey of adults found that 56% have used a multivitamin in the past 12 months. You randomly select 50 adults and ask them if they have used a multivitamin in the past 12 months. Select the correct answer below and, if necessary, fill in the answer boxes within your choice. A. No, because nq < 5. B. No, because np < 5. C. Yes, the mean is and the standard deviation is (Round to two decimal places as needed.) 28arrow_forwardA binomial experiment is given. Decide whether you can use the normal distribution to approximate the binomial distribution. If you can, find the mean and standard deviation. If you cannot, explain why. A survey of adults found that 56 % have used a multivitamin in the past 12 months. You randomly select 40 adults and ask them if they have used a multivitamin in the past 12 months. What is the mean and the standard deviation?arrow_forwardProvide an appropriate response. Use the Standard Normal Table to find the probability. IQ test scores are normally distributed with a mean of 105 and a standard deviation of 11. An individual's IQ score is found to be 114. Find the z-score corresponding to this value. Round the answer to the nearest hundredth. O A. -0.82 OB. -1.22 O C. 0.82 O D. 1.22 Carrow_forward
- Find the range, the standard deviation, and the variance for the given sample. Round non-integer results to the nearest tenth. 6, 9, 10, 14, 16, 41 range standard deviation variancearrow_forwardCfgfifpnarrow_forwardA binomial experiment is given. Decide whether you can use the normal distribution to approximate the binomial distribution. If you can, find the mean and standard deviation. If you cannot, explain why. A survey of adults found that 61% have used a multivitamin in the past 12 months. You randomly select 50 adults and ask them if they have used a multivitamin in the past 12 months.arrow_forward
- QUEST A set of final examination grades in a calculus course was found to be normally distributed with a mean of 69 and a standard deviation of 9. The top 15% of the students taking the test scored will receive a grade of B. What is the cur score?arrow_forwardUse the magnitudes (Richter scale) of the 120 earthquakes listed in the accompanying data table. Use technology to find the range, variance, and standard deviation. If another value, 8.00, is added to those listed in the data set, do the measures of variation change much? 3.272.452.542.432.752.372.192.421.911.432.851.731.992.322.332.704.742.873.382.722.833.423.952.993.873.473.082.942.703.602.842.373.033.232.593.643.242.662.352.432.813.952.522.922.983.412.272.562.933.162.201.151.934.002.542.832.352.311.522.801.951.602.452.332.081.553.201.491.812.551.662.352.452.082.192.752.002.792.392.671.692.881.841.991.862.561.972.183.671.553.162.461.881.502.793.283.822.752.452.712.541.642.183.032.361.481.922.322.651.411.391.802.242.302.481.732.402.442.482.44arrow_forwardThe ages (in years) of a random sample of shoppers at a gaming store are shown. Determine the range, mean, variance, and standard deviation of the sample data set. 12, 21, 23, 15, 20, 18, 21, 16, 15, 16 The range is 11. (Simplify your answer.) The mean is 17.7. (Simplify your answer. Round to the nearest tenth as needed.) The variance is 12.0. (Simplify your answer. Round to the nearest tenth as needed.) The standard deviation is (Simplify your answer. Round to the nearest tenth as needed.)arrow_forward
- A binomial experiment is given. Decide whether you can use the normal distribution to approximate the binomial distribution. If you can, find the mean and standard deviation. If you cannot, explain why. A survey of adults found that 65% have used a multivitamin in the past 12 months. You randomly select 50 adults and ask them if they have used a multivitamin in the past 12 months.arrow_forwardA binomial experiment is given. Decide whether you can use the normal distribution to approximate the binomial distribution. If you can, find the mean and standard deviation. If you cannot, explain why. A survey of adults found that 67% have used a multivitamin in the past 12 months. You randomly select 60 adults and ask them if they have used a multivitamin in the past 12 months. Select the correct answer below and, if necessary, fill in the answer boxes within your choice. A. No, because nq<5. B. No, because np<5. C. Yes, the mean is __and the standard deviation is __ (Round to two decimal places as needed.)arrow_forwardUse the magnitudes (Richter scale) of the 120 earthquakes listed in the accompanying data table. Use technology to find the range, variance, and standard deviation. If another value, 8.00, is added to those listed in the data set, do the measures of variation change much? 3.30 2.77 2.80 1.96 1.69 2.54 2.43 3.44 3.92 1.58 2.87 1.63 2.56 3.95 2.50 2.44 1.82 2.19 2.44 2.99 2.92 2.35 1.98 3.06 2.78 3.86 2.95 2.07 1.86 2.36 2.37 3.46 3.45 1.54 2.54 1.49 2.22 3.06 2.27 3.20 1.96 1.91 2.40 2.95 2.61 1.49 2.16 2.33 1.91 2.70 2.92 1.80 3.66 2.69 1.43 3.60 3.13 2.56 1.54 1.41 2.83 2.85 2.20 1.68 3.18 1.38 1.73 2.37 1.15 2.35 2.46 1.81 2.01 3.00 1.94 2.42 1.85 2.24 2.35 3.22 3.97 2.10 1.48 2.31 2.31 2.62 2.55 2.20 2.77 2.46 2.69 3.57 2.84 2.75 3.26 1.74 4.72 3.23 2.36 2.00 3.83 2.41 2.88 2.67 2.32 2.80 2.80 2.40 3.41 2.34 1.49 2.41 2.45 2.50 2.73 2.44 2.78 2.65 2.68 2.43 Without the extra data value, the range is 3.573.57. (Type an integer or…arrow_forward
arrow_back_ios
SEE MORE QUESTIONS
arrow_forward_ios
Recommended textbooks for you
- MATLAB: An Introduction with ApplicationsStatisticsISBN:9781119256830Author:Amos GilatPublisher:John Wiley & Sons Inc
 Probability and Statistics for Engineering and th...StatisticsISBN:9781305251809Author:Jay L. DevorePublisher:Cengage Learning
 Statistics for The Behavioral Sciences (MindTap C...StatisticsISBN:9781305504912Author:Frederick J Gravetter, Larry B. WallnauPublisher:Cengage Learning
  Elementary Statistics: Picturing the World (7th E...StatisticsISBN:9780134683416Author:Ron Larson, Betsy FarberPublisher:PEARSON
 The Basic Practice of StatisticsStatisticsISBN:9781319042578Author:David S. Moore, William I. Notz, Michael A. FlignerPublisher:W. H. Freeman
 Introduction to the Practice of StatisticsStatisticsISBN:9781319013387Author:David S. Moore, George P. McCabe, Bruce A. CraigPublisher:W. H. Freeman
MATLAB: An Introduction with Applications
Statistics
ISBN:9781119256830
Author:Amos Gilat
Publisher:John Wiley & Sons Inc
Probability and Statistics for Engineering and th...
Statistics
ISBN:9781305251809
Author:Jay L. Devore
Publisher:Cengage Learning
Statistics for The Behavioral Sciences (MindTap C...
Statistics
ISBN:9781305504912
Author:Frederick J Gravetter, Larry B. Wallnau
Publisher:Cengage Learning
Elementary Statistics: Picturing the World (7th E...
Statistics
ISBN:9780134683416
Author:Ron Larson, Betsy Farber
Publisher:PEARSON
The Basic Practice of Statistics
Statistics
ISBN:9781319042578
Author:David S. Moore, William I. Notz, Michael A. Fligner
Publisher:W. H. Freeman
Introduction to the Practice of Statistics
Statistics
ISBN:9781319013387
Author:David S. Moore, George P. McCabe, Bruce A. Craig
Publisher:W. H. Freeman