
MATLAB: An Introduction with Applications
6th Edition
ISBN: 9781119256830
Author: Amos Gilat
Publisher: John Wiley & Sons Inc
expand_more
expand_more
format_list_bulleted
Related questions
Concept explainers
Question
A batch of 3000 inverters from the production line have a mean output voltage of 337.8 V and the Standard deviation of the output voltage is 3.D V (where D is the last two digits of your student number inserted to the right of the decimal point). If the voltages of the produced inverters are assumed to be
- The number of inverters with output voltages greater than 336.9 V.
- The number of inverters with output voltages less than 337.1 V,
- The number of inverters with output voltages between 336.2 V and 339.8 V.
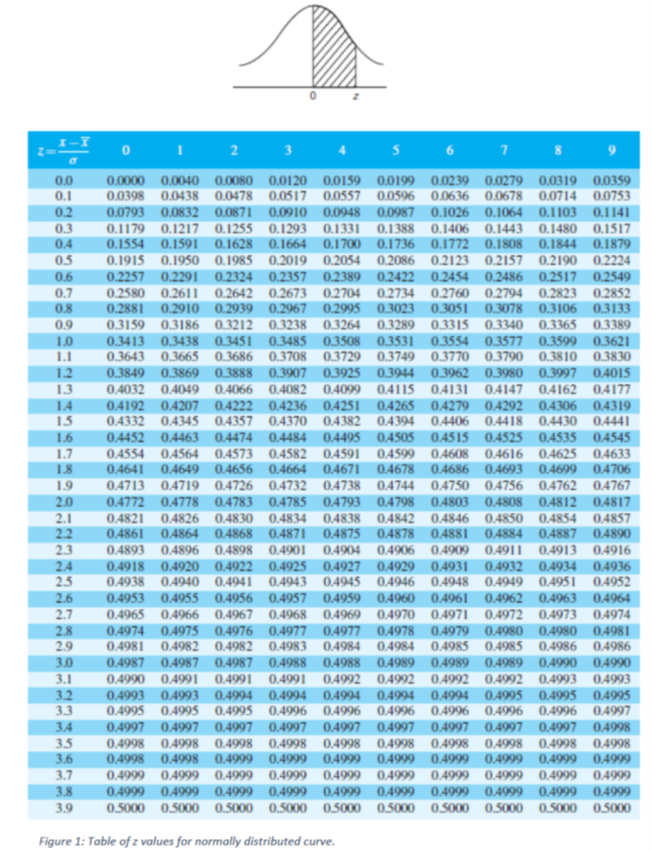
For this problem you should use the table of z-values shown in Figure below.

Transcribed Image Text:I-
01 2 3 4 s
6 7 8
0.0
0.1
0.0000 0.0040 0.0080 0.0120 0.0159 0.0199 0.0239 0.0279 0.0319 0.0359
0.0398 0.0438 0.0478 0.0517 0.0557 0.0596 0.0636 0.0678 0.0714 0.0753
0.2
0.3
0.0793 0.0832 0.0871 0.0910
0.1179 0.1217 0.1255 0.1293 0.1331
0.1554 0.1591 0.1628 0.1664 0.1700 0.1736 0.1772 0.1808
0.1915 0.1950 0.1985 0.2019 0.2054 0.2086 0.2123 0.2157 0.2190 0.2224
0.0948 0.0987 0.1026 0.1064 0.1103 0.1141
0.1388 0.1406 0.1443 0.1480 0.1517
0.1844 0.1879
0.4
0.5
0.6
0.2257 0.2291
0.2324 0.2357 0.2389 0.2422 0.2454 0.2486 0.2517 0.2549
0.7
0.2580 0.2611 0.2642 0.2673 0.2704 0.2734 0.2760 0.2794 0.2823 0.2852
0.2881
0.3159
0.2910 0.2939 0.2967
0.3186 0.3212 0.3238 0.3264
0.3438
0.2995
0.3023 0.3051
0.3289 0.331I5 0.3340
0.3078
0.3106 0.3133
0.3365
0.8
0.9
0.3389
1.0
0.3485
0.3708 0.3729 0.3749 0.3770 0.3790 0.3810
0.3907 0.3925 0.3944
0.3531
0.3413
0.3643 0.3665
0.3849
0.3451
0.3686
0.3508
0.3554 0.3577 0.3599 0.3621
1.1
0.3830
1.2
0.3869
0.3888
0.3962
0.3980
0.3997
0.4015
1.3
14
15
0.4032 0.4049 0.4066 0.4082 0.4099 0.4115
0.4192
0.4332 0.4345 0,4357 0.4370 0,4382 0.4394
0.4131 0,4147 0,4162 04177
0.4292
0.4306
0.4207 0.4222 0.4236 04251
0.4265
0.4279
0.4319
0.4406 0.4418 0.4430 04441
1.6
1.7
0.4452
0.4554 0.4564 0.4573 0.4582 0.4591
0.4641 0.4649 0,4656 0,4664 0.4671
0.4713
0.4474 0.4484
0.4495 0.4505 0.4515
0.4599
4525 0.4535
0.4625
0.4699
0.4545
0.4608
0.4616
0.4633
0.4706
1.8
0.4678
0.4686
0.4693
1.9
0.4719 0.4726 0.4732 0.4738 0.4744 0.4750 0.4756 0.4762 04767
0.4812 0.4817
0.4808
0.4850 0.4854
0.4884 0.4887
2.0
0.4772 0.4778 0.4783
0.4785 0.4793 0.4798
0.4803
2.1
2.2
0.4821
0.4861
0.4893
0.4826
0.4830 0,4834
0.4838
0.4842
0.4846
0.4857
0.4864
0.4868 0.4871
0.4875
0.4878
0.4881
0.4890
2.3
0.4896
0.4898 0.4901
0.4904
0.4906
0.4909
0.4911
0.4913
0.4916
2.4
2.5
0.4920
0.4922
0.4940 0.4941
0.4925
0.4943 0.4945 0.4946
0.4918
0.4927
0.4929
0.4932 0,4934
0.4948 0.4949 0.4951 0.4952
0.4931
0.4936
0.4938
0.4953
0.4955
0.4962
0.4970 0.4971 0.4972 0.4973
0.4979
2.6
0.4956 0.4957
0.4959
0.4960
0.4961
0.4963
0.4964
2.7
0.4965
0.4966
0.4967
0.4968
0.4969
0.4974
0.4975
0.4980
2.8
2.9
0.4974
0.4981
0.4978
0.4982 0.4982 0.4983 0.4984 0.4984 0.4985 0.4985 0.4986 0.4986
0.4976
0.4977
0.4977
0.4980
0.4981
3.0
0.4987
0.4987 0.4987 0.4988 0.4988 0.4989 0.4989 0.4989 0.4990 0.4990
3.1
0.4990
0.4991
0.4991
0.4991
0.4992 0.4992 0.4992 0.4992 0.4993
0.4993
3.2
3.3
0.4993
0.4993
0.4994
0.4995 0.4995 0.4996
0.4994
0,4994
0.4994
0.4994
0.4995
0.4996 0.4996 0.4997
0.4995
0.4995
0.4995
0.4996 0.4996 0.4996
3.4
0.4997
0.4997 0.4997 0.4997 0.4997 0.4997 0.4997
0.4997 0.4997
0.4998
3.5
3.6
3.7
0.4998
0.4998
0.4998 0.4998 0.4998 0.4998 0.4998
0.4998
0.4998 0.4998
0.4998
0.4998 0.4999 0.4999 0.4999 0.4999 0.4999 0.4999 0.4999
0.4999
0.4999
0.4999 0.4999 0.4999 0.4999
0.4999
0.4999
0.4999
0.4999
0.4999
3.8
0.4999
0.4999 0.4999 0.4999 0,4999 0.4999
0.4999
0.4999
0.4999
0,4999
3.9
0.5000 0.5000 0.5000 0.5000 0.5000 0.5000
0.5000
0.5000
0.5000
0.5000
Figure 1: Table of z values for normally distributed curve.
Expert Solution
This question has been solved!
Explore an expertly crafted, step-by-step solution for a thorough understanding of key concepts.

Step by stepSolved in 2 steps with 2 images

Knowledge Booster


Learn more about
Need a deep-dive on the concept behind this application? Look no further. Learn more about this topic, statistics and related others by exploring similar questions and additional content below.Similar questions
- 3.4.2 2. Find the following z-scores: a. Za10 b. Zo975 c. Z,005 0.15 e. Z30 "0.80 f. Z 0.30arrow_forwardThe data in the accompanying table are from a paper. Suppose that each person in a random sample of 49 male students and in a random sample of 88 female students at a particular college was classified according to gender and whether they usually or rarely eat three meals a day. Find the test statistic and P-value. (Use SALT. Round your test statistic to three decimal places and your P-value to four decimal places.) Usually Eat3 Meals a Day Rarely Eat3 Meals a Day Male 26 23 Female 35 53arrow_forwardA recent study evaluated how addicted teenagers become to nicotine once they start smoking. The response variable was the number of yes answers on a questionnaire called the Hooked on Nicotine Checklist (HONC). Of teenagers who had tried tobacco, the mean HONC score was 3.8 (s = 4.4) for the 141 females and 2.4 (s = 3.5) for the 178 males. Complete parts a through c below. a. Find the standard error comparing the sample means. Interpret. The standard error is se= 0.4540. (Round to four decimal places as needed.) What does the standard error indicate? ... OA. The standard error is the standard deviation of the sample for this study. OCT 28 OB. The standard error is the difference in standard deviations for the two populations. OC. The standard error is the standard deviation of the difference between x₁-x₂. D. The standard error describes the spread of the sampling distribution of x₁-x₂. b. Find the test statistic and P-value for Ho: H₁ H₂ and Ha: H₁ H₂. Interpret, and explain what (if…arrow_forward
- Your p value is .03 and you chose your α level to be .05. What kind of error could you be making? a. Type I error b. Type II error c. Type I and Type II error d. Neither errorsarrow_forwardLet x represent the hemoglobin count (HC) in grams per 100 milliliters of whole blood. The distribution for HC is approximately normal with μ = 14 for healthy adult women. Suppose that a female patient has taken 12 laboratory blood samples in the last year. The HC data sent to her doctor is listed below. We would like to know if the data indicates this patient has significantly high HC compared to the population. 14,19,16,14,19,19,14,21,17,17,14,17 Give the p-value and interpret the results. a) p = 0.0012; Based on 5% significance level, I will reject the null hypothesis and conclude this patient has a high HC level. b) p = 0.0012; Based on 5% significance level, I will fail to reject the null hypothesis and conclude this patient does not have a high HC level. c) p = 0.0023; Based on 5% significance level, I will reject the null hypothesis and conclude this patient has a high HC level. d) p = .1053; Based on 5% significance level, I will fail to reject the null hypothesis and…arrow_forwardSuppose that a customer is purchasing a car. He conducts an experiment in which he puts 10 gallons of gas in the car and drives it until it runs out of gas. He conducts this experiment 15 times on each car and records the number of miles driven. Median for Car 2 M = 250 mi / 10 gal (Type an integer or decimal rounded to one decimal place as needed.) Full data setO Range for Car 1 R=O mi / 10 gal (Type an integer or decimal rounded to one decimal place as needed.) Car 1 245 242 215 244 220 265 291 160 284 251 169 319 257 306 267 Range for Car 2 R=O mi / 10 gal (Type an integer or decimal rounded to one decimal place as needed.) Car 2 230 206 214 236 242 256 245 255 241 264 276 252 250 251 257arrow_forward
- Let x represent the hemoglobin count (HC) in grams per 100 milliliters of whole blood. The distribution for HC is approximately normal with μ = 14 for healthy adult women. Suppose that a female patient has taken 12 laboratory blood samples in the last year. The HC data sent to her doctor is listed below. We would like to know if the data indicates this patient has significantly high HC compared to the population. 22,17,20,17,17,14,16,21,15,21,15,22 Give the p-value and interpret the results. a) p = .1053; Based on 5% significance level, I will fail to reject the null hypothesis and conclude this patient does not have a high HC level. b) p = .0562; Based on 5% significance level, I will fail to reject the null hypothesis and conclude this patient does not have a high HC level. c) p = 0.0003; Based on 5% significance level, I will fail to reject the null hypothesis and conclude this patient does not have a high HC level. d) p = 0.0003; Based on 5% significance level, I will reject the…arrow_forwardUse the t3 I calculator.arrow_forwardQ.8arrow_forward
- Find two z values, one positive and one negative, that are equidistant from the mean so that the areas in the two tails total 6%. Use a TI-83 Plus/TI- 84 Plus calculator and round the answer to four decimal places, separated by a comma if needed. X ** $ oloarrow_forwardour p value is .03 and you chose your α level to be .05. What kind of error could you be making? a. Type I error b. Type II error c. Type I and Type II error d. Neither errorsarrow_forward
arrow_back_ios
arrow_forward_ios
Recommended textbooks for you
- MATLAB: An Introduction with ApplicationsStatisticsISBN:9781119256830Author:Amos GilatPublisher:John Wiley & Sons Inc
 Probability and Statistics for Engineering and th...StatisticsISBN:9781305251809Author:Jay L. DevorePublisher:Cengage Learning
 Statistics for The Behavioral Sciences (MindTap C...StatisticsISBN:9781305504912Author:Frederick J Gravetter, Larry B. WallnauPublisher:Cengage Learning
  Elementary Statistics: Picturing the World (7th E...StatisticsISBN:9780134683416Author:Ron Larson, Betsy FarberPublisher:PEARSON
 The Basic Practice of StatisticsStatisticsISBN:9781319042578Author:David S. Moore, William I. Notz, Michael A. FlignerPublisher:W. H. Freeman
 Introduction to the Practice of StatisticsStatisticsISBN:9781319013387Author:David S. Moore, George P. McCabe, Bruce A. CraigPublisher:W. H. Freeman
MATLAB: An Introduction with Applications
Statistics
ISBN:9781119256830
Author:Amos Gilat
Publisher:John Wiley & Sons Inc
Probability and Statistics for Engineering and th...
Statistics
ISBN:9781305251809
Author:Jay L. Devore
Publisher:Cengage Learning
Statistics for The Behavioral Sciences (MindTap C...
Statistics
ISBN:9781305504912
Author:Frederick J Gravetter, Larry B. Wallnau
Publisher:Cengage Learning
Elementary Statistics: Picturing the World (7th E...
Statistics
ISBN:9780134683416
Author:Ron Larson, Betsy Farber
Publisher:PEARSON
The Basic Practice of Statistics
Statistics
ISBN:9781319042578
Author:David S. Moore, William I. Notz, Michael A. Fligner
Publisher:W. H. Freeman
Introduction to the Practice of Statistics
Statistics
ISBN:9781319013387
Author:David S. Moore, George P. McCabe, Bruce A. Craig
Publisher:W. H. Freeman