
Algebra & Trigonometry with Analytic Geometry
13th Edition
ISBN: 9781133382119
Author: Swokowski
Publisher: Cengage
expand_more
expand_more
format_list_bulleted
Related questions
Question
4
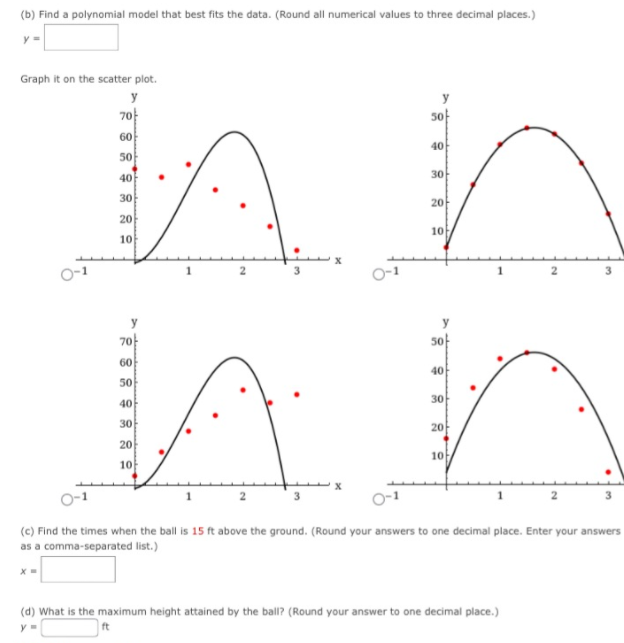

Transcribed Image Text:(b) Find a polynomial model that best fits the data. (Round all numerical values to three decimal places.)
Graph it on the scatter plot.
y
7아
60
so
4아
50
4아
30
3아
20
20아
10
10
3
O-1
y
7아
50
60
50
40
30
40
30아
20
20
10
10
3
(c) Find the times when the ball is 15 ft above the ground. (Round your answers to one decimal place. Enter your answers
as a comma-separated list.)
(d) What is the maximum height attained by the ball? (Round your answer to one decimal place.)
ft

Transcribed Image Text:A baseball is thrown upward, and its height measured at 0.5-second intervals using a strobe light. The resulting data are given
the table. (Let y be the height of the baseball in ft and x the time in seconds since it is thrown.)
Time (s)
Height (ft)
4.2
0.5
26.1
1.0
40.1
1.5
46.0
2.0
43.9
2.5
33.7
3.0
15.8
(a) Draw a scatter plot of the data.
y
7아
5아
60
40
50
40
30
30
20
20
10
10
O-1
2
2
3
3
7아
60
40
50
30
40
30
20
20
10
10
O-1
What degree polynomial is appropriate for modeling the data?
(b) Find a polynomial model that best fits the data. (Round all numerical values to three decimal places.)
Expert Solution
This question has been solved!
Explore an expertly crafted, step-by-step solution for a thorough understanding of key concepts.

This is a popular solution

Trending nowThis is a popular solution!

Step by stepSolved in 5 steps with 1 images

Knowledge Booster

Similar questions
- Table 6 shows the year and the number ofpeople unemployed in a particular city for several years. Determine whether the trend appears linear. If so, and assuming the trend continues, in what year will the number of unemployed reach 5 people?arrow_forwardMortgage Rates The following table is taken from the website of Freddie Mac. It shows rates for 30-year fixed-rate mortgages since 1970. y=Year r=Mortgagerate 1975 9.05 1980 13.74 1985 12.43 1990 10.13 1995 7.93 2000 8.05 2005 5.87 2010 4.69 2015 3.84 a. Explain in practical terms the meaning of r(2003). b. Use the table to estimate the value of r(2003).arrow_forwardTable 4 gives the population of a town (in thousand) from 2000 to 2008. What was the average rate of change of population (a) between 2002 and 2004, and (b) between 2002 and 2006?arrow_forward
- A driver of a car stopped at a gas station to fill up his gas tank. He looked at his watch, and the time read exactly 3:40 p.m. At this time, he started pumping gas into the tank. At exactly 3:44, the tank was full and he noticed that he had pumped 10.7 gallons. What is the average rate of flow of the gasoline into the gas tank?arrow_forwardThe length of a stalactite (in mm) has been measured at the beginning of every fourth year since the year 2000. The data through 2016 is shown below, where t is in years after the beginning of the year 2000. t Length (mm) O C. 0 92 Use the data to construct a scatter plot, then complete the following. 1) Which of the following best describes the pattern? OA. Exponential (y=a.b*) B. Linear (y = mx + b) Logistic y= (y= C -bx 4 98 1+ ae 8 105 2) Using your calculator and the best of the four methods above, find a model, L(t), that estimates the length of the stalactite t years after 2000. ROUND TO TWO DECIMAL PLACES. L(t) = 3) Use your rounded answer from part 2 to complete the following. ROUND TO TWO DECIMAL PLACES. Acording to the model, at the beginning of the year 2005, the stalactite was approximately mm long, and it was growing at a rate of approximately 12 110 mm per year. 16 117arrow_forwardA farmer in Indiana wants to examine the relation between the number of very hot days (days when the high temperature exceeds 95° F) and the corn production of his farm (in bushels of corn per acre). He looks at the data for 10 summers. Let x¡ = the number of hot days during the ith summer. %3D = the corn production (in bushels per acre) during the ih summer. Let yi The data are in the table below:. 4 6. 7 8. 9. 10 i 2 14 10 7. 8. 1 12 Xi Yi 95 80 83 87 88 85 99 102 79 95 a) Make a scatterplot of the data. b) Examine your scatterplot and, without performing any calculations, EXPLAIN whether you expect the correlation coefficient to be closer to -1, 0, or 1 and WHY. c) Find the sample mean and standard deviation for each variable. %3D %3D S. %3D y d) Place an asterisk on your scatterplot at the point (x,ỹ).arrow_forward
- Here is a timeplot of each monthly load factor for domestic flights for 2002 to 2017 along with a lowess smooth Answer parts a and b. A Click the icon to view the timeplot. Timeplot a) Describe the patterns you see in this plot. O A. The load factors have been increasing at a constant rate. OB. The load factors have been decreasing at a constant rate 82.5 Oc. The load factors have been increasing steadily O D. The load factors have been decreasing steadily. 75.0 b) Do you expect the overall pattern to continue for another decade? Why or why not? 67.5 O A. No. These are percentages, so they can't exceed 100% Moreover, we have no reason to believe this trend will continue O B. No. These are percentages, so they can't exceed twice the beginning value. Moreover, we have no reason to believe this trend will continue 2004 2008 2012 2016 Decimal Year O C. Yes. These values can keep increasing for exactly another decade because these percentages cannot exceed the decade O D. Yes. These values…arrow_forwardThe life expectancy of a fluorescent light bulb is given by the number of hours that it will burn. Complete the following table. Life of bulb Midpoint Frequency Product (hours) f xf -0.5-499.5 499.5-999.5 11 999.5-1,499.5 13 1,499.5-1,999.5 17 1,999.5-2,499.5 27 2,499.5-2,999.5 33 2,999.5-3,499.5 14 3,499.5-3,999.5 From the frequency distribution, find the mean life of this type of bulb (in h). (Round your answer to one decimal place.) mean =arrow_forwardThis distance-time graph shows the journey of a blackbird. Calculate the average speed of the blackbird between 4 and 14 seconds. If your answer is a decimal, give it to 1 d.p. Distance travelled (m) 40 35- 30 25 20 15 10 5 0 6 8 10 12 14 16 Time (s)arrow_forward
- The peak flow rate of a person is the fastest rate at which the person can expel air after taking a deep breath.Peak flow rate is measured in units of liters per minute and gives an indication of the person’s respiratoryhealth. Researchers measured peak flow rate and height for each of a sample of 17 men. The results are givenin the table. (image included) a. Create a scatterplot displaying the relationship between peak flow rate and height.b. Calculate the sample correlation coefficient for peak flow rate and height.c. If we were to predict the peak flow rate using height with a least-squares regression model, whatis the slope estimate ˆb?d. Continuing with part a, what is the intercept estimate ˆa?e. Based on the regression model, what is the predicted peak flow rate for a subject that is 175cmtall?f. Looking at the original data, subject 8 is 175cm tall with a peak flow rate of 670l/min. What isthe residual for this subject?g. Fit the least-squares model in R. What is the…arrow_forwardV. V MI * 00 SI The equation y = 0.491x +29.796x+193.367, with x equal to the number of years from 1988 to 1996, models a company's spending (in millions of dollars). a. Graph this function for x 0 to x= 8. b. If x= 0 in 1988, find the spending by this model in 1994. c. Is the value in part b an interpolation or an extrapolation? %3D a. Choose the correct graph of this function. O A. O D. OB. A. 000 Ay 00- -00- SS Click to select your answer and then click Check Answer 2 parts remaining Library Clear All Check Answer ptions OK ype here to search Bb 近 +D 司回 OFO F5 F7 F8 PrtSc F4 F11 6 F12 Ins %23 4. 9. G K. Alt Ctrlarrow_forwardA car traveling along a straight road is clocked at a number of points. The data from the observations are given in the following table, where the time is in seconds, the distance is in feet. Use appropriate 3-point formula and data to approximate the speed at time t=0, 3, 5, and 13. Time Distance 3 225 5 383 8 623 10 742 13 993arrow_forward
arrow_back_ios
SEE MORE QUESTIONS
arrow_forward_ios
Recommended textbooks for you
- Algebra & Trigonometry with Analytic GeometryAlgebraISBN:9781133382119Author:SwokowskiPublisher:Cengage
 Algebra: Structure And Method, Book 1AlgebraISBN:9780395977224Author:Richard G. Brown, Mary P. Dolciani, Robert H. Sorgenfrey, William L. ColePublisher:McDougal Littell
 Glencoe Algebra 1, Student Edition, 9780079039897...AlgebraISBN:9780079039897Author:CarterPublisher:McGraw Hill
  Holt Mcdougal Larson Pre-algebra: Student Edition...AlgebraISBN:9780547587776Author:HOLT MCDOUGALPublisher:HOLT MCDOUGAL

Algebra & Trigonometry with Analytic Geometry
Algebra
ISBN:9781133382119
Author:Swokowski
Publisher:Cengage
Algebra: Structure And Method, Book 1
Algebra
ISBN:9780395977224
Author:Richard G. Brown, Mary P. Dolciani, Robert H. Sorgenfrey, William L. Cole
Publisher:McDougal Littell
Glencoe Algebra 1, Student Edition, 9780079039897...
Algebra
ISBN:9780079039897
Author:Carter
Publisher:McGraw Hill
Holt Mcdougal Larson Pre-algebra: Student Edition...
Algebra
ISBN:9780547587776
Author:HOLT MCDOUGAL
Publisher:HOLT MCDOUGAL