
Human Anatomy & Physiology (11th Edition)
11th Edition
ISBN: 9780134580999
Author: Elaine N. Marieb, Katja N. Hoehn
Publisher: PEARSON
expand_more
expand_more
format_list_bulleted
Related questions
Question
Answer A-E

Transcribed Image Text:A
B
C
D
E
F
G
H
K
M
N
O
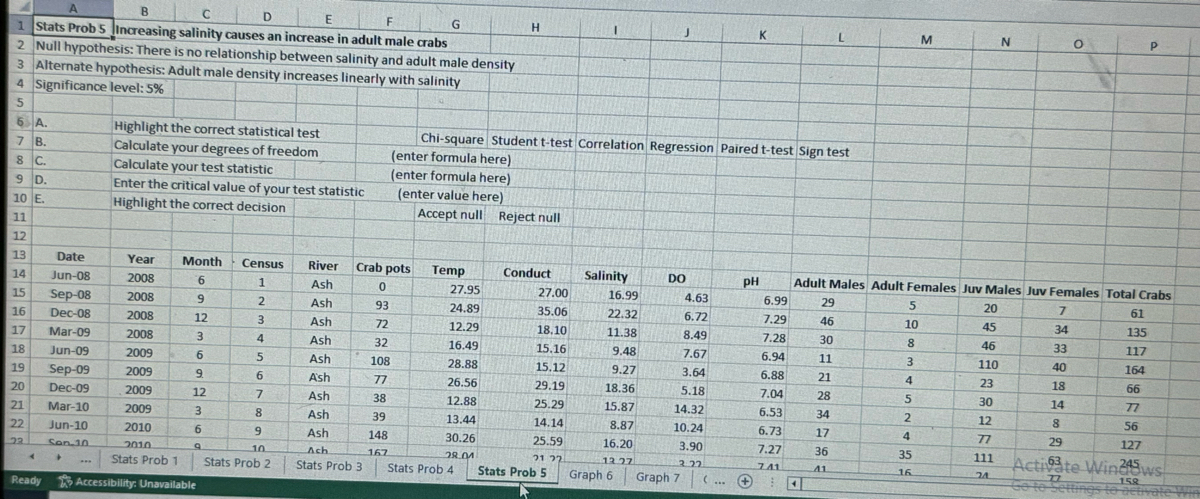
1 Stats Prob 5 Increasing salinity causes an increase in adult male crabs
2 Null hypothesis: There is no relationship between salinity and adult male density
3 Alternate hypothesis: Adult male density increases linearly with salinity
4 Significance level: 5%
5
6 A.
Highlight the correct statistical test
Calculate your degrees of freedom
Calculate your test statistic
Chi-square Student t-test Correlation Regression Paired t-test Sign test
(enter formula here)
7 B.
8 C.
(enter formula here)
9 D.
Enter the critical value of your test statistic
(enter value here)
10 E.
Highlight the correct decision
Accept null Reject null
11
12
13
Date
Year Month
Census
River Crab pots
Temp
Conduct
Salinity
DO
PH
Adult Males Adult Females Juv Males Juv Females Total Crabs
14
Jun-08
2008
6
1
Ash
0
27.95
27.00
16.99
4.63
6.99
29
5
20
7
61
15
Sep-08
2008
9
2
Ash
93
24.89
35.06
22.32
6.72
7.29
46
10
45
34
135
16
Dec-08
2008
12
3
Ash
72
12.29
18.10
11.38
8.49
7.28
30
8
46
33
117
17
Mar-09
2008
3
4
Ash
32
16.49
15.16
9.48
7.67
6.94
11
3
110
40
18
164
Jun-09
2009
6
5
Ash
108
28.88
15.12
9.27
3.64
6.88
21
4
23
18
66
19
Sep-09
2009
9.
6
Ash
77
26.56
29.19
18.36
5.18
7.04
28
5
30
14
77
20
Dec-09
2009
12
7
Ash
38
12.88
25.29
15.87
14.32
6.53
34
2
12
8
56
21
Mar-10
2009
3
8
Ash
39
13.44
14.14
8.87
10.24
6.73
17
4
77
29
127
22
Jun-10
2010
6
9
Ash
148
30.26
25.59
16.20
3.90
7.27
36
35
111
22
Sen 10
2010
9
Ach
167
28.01
21 22
12.27
2.22
741
16
Stats Prob 1
24
Stats Prob 2
Stats Prob 3
Stats Prob 4
Stats Prob 5
Graph 6
Graph 7
(
+
4
Activate WindSws
Go to
77
158
Ready
Accessibility: Unavailable

Transcribed Image Text:Jun-10
2010
6
9
Ash
148
30.26
25.59
16.20
3.90
7.27
36
35
111
63
245
23
Sep-10
2010
9
10
Ash
167
28.04
21.22
13.27
3.22
7.41
41
16
24
77
158
24
Dec-10
2010
12
11
Ash
61
11.31
30.22
19.40
9.35
7.03
28
1
17
2
48
25
Mar-11
2010
3
12
Ash
24
15.95
17.78
11.23
7.20
6.63
15
2
25
9
51
26
Jun-08
2008
6
1
Com
0
29.47
26.26
16.53
4.71
7.07
36
2
37
21
96
27
Sep-08
2008
9
2
Com
154
28.34
31.67
20.12
5.26
7.15
57
21
28
13
119
28
Dec-08
2008
12
3
Com
33
12.54
21.69
13.64
8.75
7.37
52
9
37
35
133
29
Mar-09
2008
3
4
Com
116
16.83
16.23
10.11
7.60
7.06
2
3
36
12
53
30
Jun-09
2009
6
5
Com
221
27.90
15.63
9.61
4.40
6.95
12
9
19
13
53
31
Sep-09
2009
9
6
Com
69
27.68
33.86
21.47
5.30
7.00
23
4
33
18
78
32
Dec-09
2009
12
7
Com
163
12.87
23.77
15.05
14.81
6.52
7
3
10
8
28
33
Mar-10
2009
3
8
Com
83
13.94
12.46
7.55
10.53
6.95
15
5
48
28
96
34
Jun-10
2010
6
9
Com
150
30.71
28.02
17.54
3.94
7.18
19
6
42
12
79
35
Sep-10
2010
9
10
Com
116
28.48
27.71
17.41
3.71
7.50
48
35
21
24
128
36
Dec-10
2010
12
11
Com
72
12.19
35.51
22.89
8.75
6.81
17
6
15
9
47
37
Mar-11
2010
3
12
Com
91
15.69
20.30
12.76
7.41
6.31
1
1
20
7
29
38
Jun-08
2008
6
1
Eds
0
29.33
26.53
17.05
7.09
7.32
2
2
53
15
72
39
Sep-08
2008
9
2
Eds
40
27.15
25.73
16.61
7.51
7.27
9
23
8
9
49
40
Dec-08
2008
12
3
Eds
28
11.33
18.57
11.90
9.07
7.30
6
6
8
9
29
41
Mar-09
2008
3
4
Eds
154
16.82
16.52
10.53
8.45
6.93
3
9
11
10
33
42
Jun-09
2009
6
5
Eds
35
27.89
15.28
9.65
5.07
7.07
3
7
5
3
18
43
Sep-09
2009
9
6
Eds
20
27.18
24.85
15.91
7.55
7.22
6
5
38
15
64
44
Dec-09
2009
12
7
Eds
91
13.43
14.15
9.01
16.14
6.60
6
14
7
20
47
45
Mar-10
2009
3
8
Eds
87
13.57
17.65
11.31
10.71
6.96
10
3
8
8
29
46
Jun-10
2010
6
9
Eds
31
29.88
22.96
18.41
5.05
7.33
8
8
57
18
91
47
Sep-10
2010
9
10
Eds
83
28.11
24.33
15.70
5.47
7.65
22
6
29
22
79
48
Dec-10
2010
12
11
Eds
35
11.03
24.53
15.91
10.02
7.03
12
6
15
8
41
49
Mar-11
2010
3
12
Eds
30
14.51
22.75
14.76
8.05
6.78
3
15
7
11
36
50
Expert Solution
This question has been solved!
Explore an expertly crafted, step-by-step solution for a thorough understanding of key concepts.

Step by stepSolved in 2 steps with 3 images

Knowledge Booster

Similar questions
arrow_back_ios
arrow_forward_ios
Recommended textbooks for you
- Human Anatomy & Physiology (11th Edition)BiologyISBN:9780134580999Author:Elaine N. Marieb, Katja N. HoehnPublisher:PEARSON
 Biology 2eBiologyISBN:9781947172517Author:Matthew Douglas, Jung Choi, Mary Ann ClarkPublisher:OpenStax
 Anatomy & PhysiologyBiologyISBN:9781259398629Author:McKinley, Michael P., O'loughlin, Valerie Dean, Bidle, Theresa StouterPublisher:Mcgraw Hill Education,
  Molecular Biology of the Cell (Sixth Edition)BiologyISBN:9780815344322Author:Bruce Alberts, Alexander D. Johnson, Julian Lewis, David Morgan, Martin Raff, Keith Roberts, Peter WalterPublisher:W. W. Norton & Company
 Laboratory Manual For Human Anatomy & PhysiologyBiologyISBN:9781260159363Author:Martin, Terry R., Prentice-craver, CynthiaPublisher:McGraw-Hill Publishing Co.
 Inquiry Into Life (16th Edition)BiologyISBN:9781260231700Author:Sylvia S. Mader, Michael WindelspechtPublisher:McGraw Hill Education
Human Anatomy & Physiology (11th Edition)
Biology
ISBN:9780134580999
Author:Elaine N. Marieb, Katja N. Hoehn
Publisher:PEARSON
Biology 2e
Biology
ISBN:9781947172517
Author:Matthew Douglas, Jung Choi, Mary Ann Clark
Publisher:OpenStax
Anatomy & Physiology
Biology
ISBN:9781259398629
Author:McKinley, Michael P., O'loughlin, Valerie Dean, Bidle, Theresa Stouter
Publisher:Mcgraw Hill Education,
Molecular Biology of the Cell (Sixth Edition)
Biology
ISBN:9780815344322
Author:Bruce Alberts, Alexander D. Johnson, Julian Lewis, David Morgan, Martin Raff, Keith Roberts, Peter Walter
Publisher:W. W. Norton & Company
Laboratory Manual For Human Anatomy & Physiology
Biology
ISBN:9781260159363
Author:Martin, Terry R., Prentice-craver, Cynthia
Publisher:McGraw-Hill Publishing Co.
Inquiry Into Life (16th Edition)
Biology
ISBN:9781260231700
Author:Sylvia S. Mader, Michael Windelspecht
Publisher:McGraw Hill Education