
Chemistry
10th Edition
ISBN: 9781305957404
Author: Steven S. Zumdahl, Susan A. Zumdahl, Donald J. DeCoste
Publisher: Cengage Learning
expand_more
expand_more
format_list_bulleted
Related questions
Concept explainers
Question

Transcribed Image Text:## Phase Diagram Analysis
### Explanation
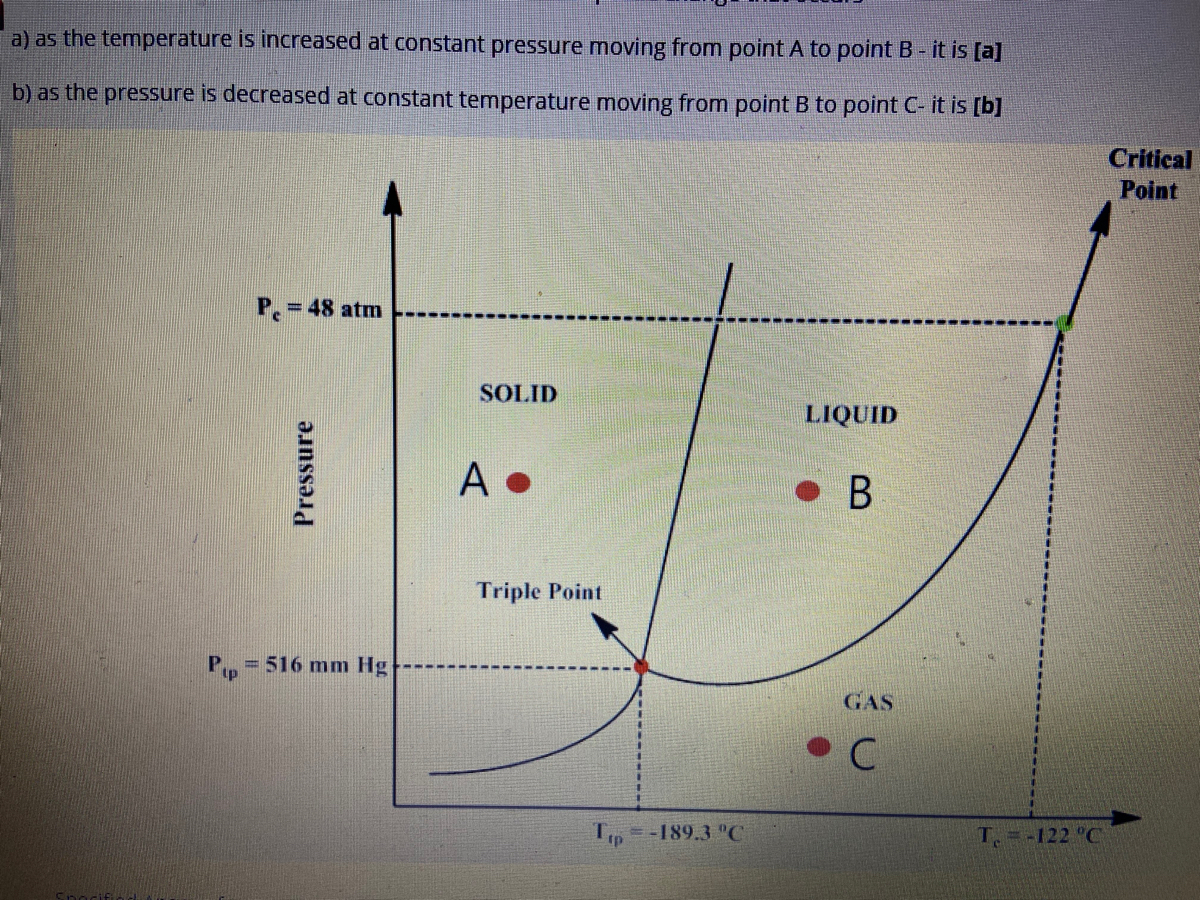
The diagram presented is a phase diagram illustrating the states of matter (solid, liquid, and gas) under varying conditions of temperature and pressure. Key elements of the diagram include distinct regions labelled for each phase, phase boundaries, a triple point, and a critical point.
### Diagram Details
- **Axes:**
- The vertical axis represents **Pressure**.
- The horizontal axis represents **Temperature**.
- **Regions:**
- The **Solid** phase is labeled as Region A.
- The **Liquid** phase is labeled as Region B.
- The **Gas** phase is labeled as Region C.
- **Key Points:**
- **Triple Point:** This is where all three phases coexist. It is marked on the diagram with a specific pressure (\(P_{tp} = 516 \, \text{mm Hg}\)) and temperature (\(T_{tp} = -189.3^\circ \text{C}\)).
- **Critical Point:** The diagram also shows a critical point at the far end of the liquid-gas boundary, beyond which the distinction between liquid and gas phases ceases.
### Phase Transitions
- **Solid to Liquid Transition:**
- At constant pressure \(P_e = 48 \, \text{atm}\), increasing temperature will cause a transition from Solid (Point A) to Liquid (Point B).
- **Liquid to Gas Transition:**
- At constant temperature \(T_c = -122^\circ \text{C}\), decreasing pressure will transition the state from Liquid (Point B) to Gas (Point C).
This phase diagram effectively illustrates the conditions under which different phases of matter exist for a given substance, aiding in understanding phase transitions under varying thermal and pressure circumstances.
Expert Solution
This question has been solved!
Explore an expertly crafted, step-by-step solution for a thorough understanding of key concepts.

This is a popular solution

Trending nowThis is a popular solution!

Step by stepSolved in 3 steps with 1 images

Knowledge Booster


Learn more about
Need a deep-dive on the concept behind this application? Look no further. Learn more about this topic, chemistry and related others by exploring similar questions and additional content below.Similar questions
- Refer to the following phase diagram (not to scale!) for argon: 48 1.00 P atm 0.68 83.8 83.9 87.4 150.6 T Kelvin A sample of argon at a pressure of 0.680 atm and a temperature of 82.5 K is compressed at constant temperature to a pressure of 52.8 atm. Which of the following are true? Choose all that apply O No phase change will occur. O The final state of the substance is a solid. The liquid initially present will vaporize. The sample is initially a gas. O The sample is initially a solid. Droviousarrow_forwardR 0.0821 Lx atm Mol x K 1. 4.0 ml of a liquid weighs (has a mass of) 100.0 g. What is the density of the liquid? a) 0.400 g/ml b) 0.025 g/ml c) 0.04 g/ml d) 25.0 g/ml 2. What is the name of the change in phase from gas to liquid? a) Condensation b) Freezing c) Melting d) Boiling 3. What is the charge on a proton? a) +1 b)-1 c) 0arrow_forwardBased on your knowledge of intermolecular forces, a container of liquid SOBr, has a higher vapor pressure than a container of liquid Br2. O True O Falsearrow_forward
- [References) Use the References to access important values if needed for this question. Refer to the following phase diagram (not to scale!) for xenon: 57.6 1.00 atm 0.37 152.0 161.3 165.0 289.7 T Kelvin A sample of xenon at a pressure of 0.370 atm and a temperature of 140 K is compressed at constant temperature to a pressure of 66.5 atm. Which of the following are true? Choose all that apply | The sample is initially a gas. O No phase change will occur. O The solid initially present will vaporize. O The final state of the substance is a solid. Previous O The sample is initially a solid. En rcharrow_forwardPlease solve the below questions using the attached diagram: If I had a quantity of this substance at a pressure 2.0 atm and a temperature of -150 degrees celsius, what phas change(s) would occur if I decreased the pressure to 0.25 atm? At what pressure(s) would they occur? (Note: multiple answers needed for this question)arrow_forwardRefer to the following phase diagram (not to scale!) for sulfur dioxide: P atm 78 1.00 0.0017 197.6 200.4 Choose all that apply T Kelvin A sample of sulfur dioxide at a pressure of 1.70×10⁻³ atm and a temperature of 266 K is compressed at constant temperature to a pressure of 83.7 atm. Which of the following are true? 263.1 430.7 The sample is initially a gas. The liquid initially present will vaporize. The final state of the substance is a liquid. The sample is initially a solid. One or more phase changes will occur.arrow_forward
- Canvas Ā Question 32 At which point in the phase diagram below can one observe freezing and boiling simultaneously? Phase II tx Phase I Phase III d I atm P O Point (d) Point (b) O Point (a) O Point (c) T MacBook Proarrow_forwardThe enthalpy of vaporization of Substance x is 7.00 kJ/mol and its normal boiling point is -10c . Calculate the vapor pressure of x at -36c. Round your answer to 2 significant digitsarrow_forward$ 4 R F [Review Topics] Refer to the following phase diagram (not to scale!) for neon: P atm 26.2 1 1.00 V 0.425 Choose all that apply T Kelvin A sample of neon at a pressure of 1.00 atm and a temperature of 26.3 K is heated at constant pressure to a temperature of 51.6 K. Which of the following are true? 5 The liquid initially present will solidify. The final state of the substance is a gas. The sample is initially a solid. One or more phase changes will occur. The sample is initially a liquid. T G 244 24.5 E B Cengage Learning Cengage Technical Support 6 MacBook Air Y H 27.1 44.4 & 7 N U J 8 M D-II 1 K ( 9 H 4 [References] O ) O L P 18 command A . ; option { [ Previous + ? 11 ✰ ✰ O Next> Save and Exit Ne X 1 delete 1: S + Update V D (?arrow_forward
arrow_back_ios
arrow_forward_ios
Recommended textbooks for you
- ChemistryChemistryISBN:9781305957404Author:Steven S. Zumdahl, Susan A. Zumdahl, Donald J. DeCostePublisher:Cengage Learning
 ChemistryChemistryISBN:9781259911156Author:Raymond Chang Dr., Jason Overby ProfessorPublisher:McGraw-Hill Education
 Principles of Instrumental AnalysisChemistryISBN:9781305577213Author:Douglas A. Skoog, F. James Holler, Stanley R. CrouchPublisher:Cengage Learning
  Organic ChemistryChemistryISBN:9780078021558Author:Janice Gorzynski Smith Dr.Publisher:McGraw-Hill Education
 Chemistry: Principles and ReactionsChemistryISBN:9781305079373Author:William L. Masterton, Cecile N. HurleyPublisher:Cengage Learning
 Elementary Principles of Chemical Processes, Bind...ChemistryISBN:9781118431221Author:Richard M. Felder, Ronald W. Rousseau, Lisa G. BullardPublisher:WILEY
Chemistry
Chemistry
ISBN:9781305957404
Author:Steven S. Zumdahl, Susan A. Zumdahl, Donald J. DeCoste
Publisher:Cengage Learning
Chemistry
Chemistry
ISBN:9781259911156
Author:Raymond Chang Dr., Jason Overby Professor
Publisher:McGraw-Hill Education
Principles of Instrumental Analysis
Chemistry
ISBN:9781305577213
Author:Douglas A. Skoog, F. James Holler, Stanley R. Crouch
Publisher:Cengage Learning
Organic Chemistry
Chemistry
ISBN:9780078021558
Author:Janice Gorzynski Smith Dr.
Publisher:McGraw-Hill Education
Chemistry: Principles and Reactions
Chemistry
ISBN:9781305079373
Author:William L. Masterton, Cecile N. Hurley
Publisher:Cengage Learning
Elementary Principles of Chemical Processes, Bind...
Chemistry
ISBN:9781118431221
Author:Richard M. Felder, Ronald W. Rousseau, Lisa G. Bullard
Publisher:WILEY