MATLAB: An Introduction with Applications
6th Edition
ISBN: 9781119256830
Author: Amos Gilat
Publisher: John Wiley & Sons Inc
expand_more
expand_more
format_list_bulleted
Question

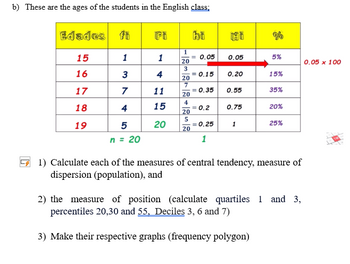
Transcribed Image Text:b) These are the ages of the students in the English class;
Edades
15
16
17
18
19
1
3
7
4
5
n = 20
Fi
1
4
11
15
20
1
20
3
20
7
20
4
20
5
20
hi
= 0.05
= 0.15
= 0.35
= 0.2
= 0.25
1
0.05
0.20
0.55
0.75
1
5%
15%
35%
20%
25%
1) Calculate each of the measures of central tendency, measure of
dispersion (population), and
2) the measure of position (calculate quartiles 1 and 3,
percentiles 20,30 and 55, Deciles 3, 6 and 7)
3) Make their respective graphs (frequency polygon)
0.05 x 100

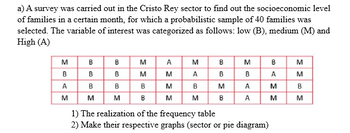
Transcribed Image Text:a) A survey was carried out in the Cristo Rey sector to find out the socioeconomic level
of families in a certain month, for which a probabilistic sample of 40 families was
selected. The variable of interest was categorized as follows: low (B), medium (M) and
High (A)
M
B
A
M
B
B
B
M
B
B
M
M
B
B
A
M
M
M
M
A
B
M
B
B
M
B
M
BA
M
1) The realization of the frequency table
2) Make their respective graphs (sector or pie diagram)
A
B
A
ΣΣ
M
ΣΣΟΣ
M
B
M
Expert Solution
This question has been solved!
Explore an expertly crafted, step-by-step solution for a thorough understanding of key concepts.
Step 1: Interpret the question
VIEW Step 2: Construct the frequency table
VIEW Step 3: Represent the frequencies graphically
VIEW Step 4: State given data
VIEW Step 5: Calculate the central Measures - mean, median and mode
VIEW Step 6: Calculate the standard deviation
VIEW Step 7: Calculate measures of position - Quartiles
VIEW Step 8: Calculate percentiles and deciles
VIEW Solution
VIEW Step by stepSolved in 9 steps with 12 images

Knowledge Booster
Similar questions
- The Bureau of Labor Statistics reports that the official unemployment rate for Black people was 10.4% and 4.7% for White people in February 2015. Select all correct answers for this question. O The samples of white and black people are independent. The explanatory variable is the unemployment rate. The response variable is the unemployment rate. The response variable is race.arrow_forwardC. Predicting Student Success STA believes there is a relationship between high school GPA (on a four-point scale) and college performance (as measured by GPA on a four-point scale). The following data were randomly selected from among students enrolling Fall 2020. HS GPA STA GPA Student 1 HS GPA STAGPA Student 21 2.9 2.5 3.6 3.4 2 3.4 3.1 3.0 22 3.4 4.0 1.7 3 3.1 23 2.9 2.9 1.7 3.0 3.2 3.3 4 24 3.5 5 3.4 25 4.0 3.6 3.6 3.0 26 3.6 3.8 3.2 3.9 3.1 27 8. 4.0 3.9 28 3.4 3.6 3.2 9. 3.0 3.0 29 3.7 10 2.9 2.0 3.0 30 4.0 3.3 4.0 3.2 11 3.3 31 12 3.6 3.8 32 3.7 3.2 3.4 3.0 13 3.7 3.9 33 14 3.8 3.6 34 2.5 2.0 15 2.5 2.5 35 2.9 2.9 3.7 2.2 16 2.9 2.5 36 3.8 17 2.8 2.1 37 2.9 18 3.8 1.7 3.5 38 3.6 3.5 3.6 19 3.7 39 3.6 20 3.9 3.0 40 3.1 3.6 How confident should St. Mary's be regarding the accuracy of their predictions? Why?arrow_forwardC. Predicting Student Success STA believes there is a relationship between high school GPA (on a four-point scale) and college performance (as measured by GPA on a four-point scale). The following data were randomly selected from among students enrolling Fall 2020. HS GPA STA GPA Student 1 HS GPA STAGPA Student 21 2.9 2.5 3.6 3.4 2 3.4 3.1 3.0 22 3.4 4.0 1.7 3 3.1 23 2.9 2.9 1.7 3.0 3.2 3.3 4 24 3.5 5 3.4 25 4.0 3.6 3.6 3.0 26 3.6 3.8 3.2 3.9 3.1 27 8. 4.0 3.9 28 3.4 3.6 3.2 9. 3.0 3.0 29 3.7 10 2.9 2.0 3.0 30 4.0 3.3 4.0 3.2 11 3.3 31 12 3.6 3.8 32 3.7 3.2 3.4 3.0 13 3.7 3.9 33 14 3.8 3.6 34 2.5 2.0 15 2.5 2.5 35 2.9 2.9 3.7 2.2 16 2.9 2.5 36 3.8 17 2.8 2.1 37 2.9 18 3.8 1.7 3.5 38 3.6 3.5 3.6 19 3.7 39 3.6 20 3.9 3.0 40 3.1 3.6 Is high school GPA a good predictor of STA GPA? Why? What STA GPA would you predict for a student with a high school GPA of 3.75? How you would make the prediction.arrow_forward
- What statistical test would a researcher use to test the following research hypothesis: Individuals who report less favorable attitudes toward the police are more likely to be sentenced to higher security prisons. Attitudes measured as 1 = very favorable, 2 = somewhat favorable, 3 = somewhat not favorable, and 4 = not at all favorable. Sentences measured as 1 = minimum, 2 = medium, and 3 = maximum.arrow_forwardA group of 600 patients who suffer from seasonal allergies is asked to participate in a study to determine the effectiveness of a new medication. The patients are divided randomly into two groups, one was given the actual medication and one received a placebo pill. After 2 months of treatment, 64% of the patients who took the medication had fewer allergy symptoms, while only 36% of those who took the placebo had fewer allergy symptoms. a. What is the treatment variable? b. What is the response (or outcome) variable? c. Was this an observational study or a controlled experiment? Explain how you know. d. Assuming the rest of the study was well-designed, use your answers to discuss whether it would be reasonable to conclude that taking the new medication caused fewer allergy symptoms.arrow_forwardHow do the average weekly incomes of electricians and carpenters compare? A random sample of 17 regions in the United States gave the following information about average weekly income (in dollars). (Reference: U.S. Department of Labor, Bureau of Labor Statistics.) Region 1 2 3 4 5 6 7 8 9 Electricians 464 715 597 464 736 694 744 571 806 Carpenters 542 813 513 476 688 503 789 653 474 Region 10 11 12 13 14 15 16 17 Electricians 592 594 702 579 868 598 597 654 Carpenters 489 647 676 384 817 605 556 505 Does this information indicate a difference (either way) in the average weekly incomes of electricians compared to those of carpenters? Use a 5% level of significance. (a) What is the level of significance? (b) Compute the sample test statistic. (c) Find the P-value of the sample test statistic.arrow_forward
- A study prospectively examined whether sleep-disordered breathing was associated with an increased risk of death from any cause in a cohort of 600 adults participating in the Sleep Heart Health Study. Study participants were classified into four groups depending on the extent of their sleep-disordered breathing (none, mild, moderate, or severe). The counts of deaths over the course of the study are reported for each group in the following two-way table. Mild Severe 100 Death No Death Total None 40 100 140 40 100 140 Moderate 20 100 120 Total 200 400 600 100 200 We want to know whether the study findings give evidence of a significant difference of the number of deaths between the different groups. Set up the alternative hypothesis (H, : The distribution of the categorical variable is not as given by the null hypothesis (lack of fit) At least ones of the means is different from the others O The two categorical variables are dependent The distribution of the categorical variable is not…arrow_forwardA study prospectively examined whether sleep-disordered breathing was associated with an increased risk of death from any cause in a cohort of 600 adults participating in the Sleep Heart Health Study. Study participants were classified into four groups depending on the extent of their sleep-disordered breathing (none, mild, moderate, or severe). The counts of deaths over the course of the study are reported for each group in the following two-way table. Death No Death Total None 40 100 140 Mild 40 100 140 Moderate 20 100 120 Severe 100 100 200 Total 200 400 600 We want to know whether the study findings give evidence of a significant difference of the number of deaths between the different groups. The observed test statistic is 3.610 42.857 5.476 8.075arrow_forwardA random survey of health issues, conducted by the Department of Public Health of the Commonwealth of Massachusetts, examined the results from the state's seven largest cities. These cities were selected on the basis of their diverse racial and ethnic populations. The percentage of adults with diabetes in each city in the survey is given in the following table. City Boston Worcester Springfield Lowell Fall River Lawrence NewBedford Adults withDiabetes (%) 4.2 5.2 9.1 5.7 8.1 7.9 6.3 Find the average percentage of adults with diabetes in these seven cities. (Round your answer to two decimal places.) %What is the standard deviation for these data? (Round your answer to two decimal places.) %arrow_forward
arrow_back_ios
arrow_forward_ios
Recommended textbooks for you
 MATLAB: An Introduction with ApplicationsStatisticsISBN:9781119256830Author:Amos GilatPublisher:John Wiley & Sons Inc
 Probability and Statistics for Engineering and th...StatisticsISBN:9781305251809Author:Jay L. DevorePublisher:Cengage Learning
 Statistics for The Behavioral Sciences (MindTap C...StatisticsISBN:9781305504912Author:Frederick J Gravetter, Larry B. WallnauPublisher:Cengage Learning
 Elementary Statistics: Picturing the World (7th E...StatisticsISBN:9780134683416Author:Ron Larson, Betsy FarberPublisher:PEARSON
 The Basic Practice of StatisticsStatisticsISBN:9781319042578Author:David S. Moore, William I. Notz, Michael A. FlignerPublisher:W. H. Freeman
 Introduction to the Practice of StatisticsStatisticsISBN:9781319013387Author:David S. Moore, George P. McCabe, Bruce A. CraigPublisher:W. H. Freeman

MATLAB: An Introduction with Applications
Statistics
ISBN:9781119256830
Author:Amos Gilat
Publisher:John Wiley & Sons Inc

Probability and Statistics for Engineering and th...
Statistics
ISBN:9781305251809
Author:Jay L. Devore
Publisher:Cengage Learning

Statistics for The Behavioral Sciences (MindTap C...
Statistics
ISBN:9781305504912
Author:Frederick J Gravetter, Larry B. Wallnau
Publisher:Cengage Learning

Elementary Statistics: Picturing the World (7th E...
Statistics
ISBN:9780134683416
Author:Ron Larson, Betsy Farber
Publisher:PEARSON

The Basic Practice of Statistics
Statistics
ISBN:9781319042578
Author:David S. Moore, William I. Notz, Michael A. Fligner
Publisher:W. H. Freeman

Introduction to the Practice of Statistics
Statistics
ISBN:9781319013387
Author:David S. Moore, George P. McCabe, Bruce A. Craig
Publisher:W. H. Freeman