MATLAB: An Introduction with Applications
6th Edition
ISBN: 9781119256830
Author: Amos Gilat
Publisher: John Wiley & Sons Inc
expand_more
expand_more
format_list_bulleted
Question

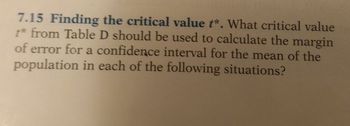
Transcribed Image Text:7.15 Finding the critical value t*. What critical value
t* from Table D should be used to calculate the margin
of error for a confidence interval for the mean of the
population in each of the following situations?

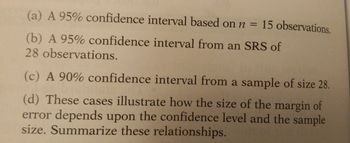
Transcribed Image Text:(a) A 95% confidence interval based on n = 15 observations.
(b) A 95% confidence interval from an SRS of
28 observations.
(c) A 90% confidence interval from a sample of size 28.
(d) These cases illustrate how the size of the margin of
error depends upon the confidence level and the sample
size. Summarize these relationships.
Expert Solution
This question has been solved!
Explore an expertly crafted, step-by-step solution for a thorough understanding of key concepts.
This is a popular solution
Trending nowThis is a popular solution!
Step by stepSolved in 4 steps with 6 images

Knowledge Booster
Similar questions
- If X=68, σ=14, and n=66, construct a 95% confidence interval estimate of the population mean, μarrow_forward例题5: A 90 percent confidence interval is to be created to estimate the proportion of television viewers in a certain area who favor moving the broadcast of the late weeknight news to an hour earlier than it is currently. Initially, the confidence interval will be created using a simple random sample of 9,000 viewers in the area. Assuming that the sample proportion does not change, what would be the relationship between the width of the original confidence interval and the width of a second 90 confidence interval that is created based on a sample of only 1,000 viewers in the percent area? (A) The second confidence interval would be 9 times as wide as the original confidence interval. (B) The second confidence interval would be 3 times as wide as the original confidence interval. (C) The width of the second confidence interval would be equal to the width of the original confidence interval. (D) The second confidence interval would be 13 as wide as the original confidence interval. (E)…arrow_forwardfind the t sub alpha/2 when n=23 for the 95% confidence interval.arrow_forward
- Echinacea is widely used as an herbal remedy for the common cold, but does it work? In a double-blind experiment, healthy volunteers agreed to be exposed to common-cold-causing rhinovirus type 39 and have their symptoms monitored. The volunteers were randomly assigned to take either a placebo or an echinacea supplement daily for 5 days following viral exposure. Among the 103 subjects taking a placebo, 88 developed a cold, whereas 44 of the 48 subjects taking echinacea 1 developed a cold.arrow_forwardA researcher is trying to estimate the population mean (μ) of anxiety based on his sample of n = 16 scores. His sample M = 58 and the s = 5.36. Construct the 95% confidence interval for μ.arrow_forwardyou conducted additional studies with these men and found the following: a. The RR for those who drank one drink per day was 1.50 (95% CI:1.32-1.67) in comparison to the abstainers. b. For those men who drank three or more drinks per day the RR compared to the abstainers was 4.20 (95% CI 2.68-5.85). Question: We can tell from the Confidence Intervals provided in #7 whether there are likely more people in the “one drink a day” group or the “3+ drinks per day” group. Which one likely has more people and how can we tell?arrow_forward
- You are going to create a 99% confidence interval for the mean amount ofsugar in coffee shop specialty drinks. You know the population standarddeviation is σ = 5.9 grams. You want your confidence interval to have amargin of error of 0.25 grams. How big should your sample size be to obtainthis margin of error?arrow_forwardA simple random sample of size n=51 is taken from a normally distributed original population. The sample standard deviation is s=27. Find the 95% confidence interval for the population standard deviation O.arrow_forwardFrom chapter 14, review activity #19. A recent survey of 200 households showed that 8 had a single male as the head of the household. Forty years ago, a survey of 200 households showed that 6 had a single male as the head of the household. Car it be concluded that the proportion has changed, based on a 95% confidence interval? Recall the confidence interval is calculated as (-0.0261, 0.0461) A) Yes, the proportion changed since 0 is in the interval. B) Yes, the proportion changed since O is NOT in the interval. C) No, the proportion did not change since 0 is in the interval. D) No, the proportion did not change since 0 is NOT in the interval. E) We cannot determine the conclusion from the confidence intervalarrow_forward
arrow_back_ios
arrow_forward_ios
Recommended textbooks for you
 MATLAB: An Introduction with ApplicationsStatisticsISBN:9781119256830Author:Amos GilatPublisher:John Wiley & Sons Inc
 Probability and Statistics for Engineering and th...StatisticsISBN:9781305251809Author:Jay L. DevorePublisher:Cengage Learning
 Statistics for The Behavioral Sciences (MindTap C...StatisticsISBN:9781305504912Author:Frederick J Gravetter, Larry B. WallnauPublisher:Cengage Learning
 Elementary Statistics: Picturing the World (7th E...StatisticsISBN:9780134683416Author:Ron Larson, Betsy FarberPublisher:PEARSON
 The Basic Practice of StatisticsStatisticsISBN:9781319042578Author:David S. Moore, William I. Notz, Michael A. FlignerPublisher:W. H. Freeman
 Introduction to the Practice of StatisticsStatisticsISBN:9781319013387Author:David S. Moore, George P. McCabe, Bruce A. CraigPublisher:W. H. Freeman

MATLAB: An Introduction with Applications
Statistics
ISBN:9781119256830
Author:Amos Gilat
Publisher:John Wiley & Sons Inc

Probability and Statistics for Engineering and th...
Statistics
ISBN:9781305251809
Author:Jay L. Devore
Publisher:Cengage Learning

Statistics for The Behavioral Sciences (MindTap C...
Statistics
ISBN:9781305504912
Author:Frederick J Gravetter, Larry B. Wallnau
Publisher:Cengage Learning

Elementary Statistics: Picturing the World (7th E...
Statistics
ISBN:9780134683416
Author:Ron Larson, Betsy Farber
Publisher:PEARSON

The Basic Practice of Statistics
Statistics
ISBN:9781319042578
Author:David S. Moore, William I. Notz, Michael A. Fligner
Publisher:W. H. Freeman

Introduction to the Practice of Statistics
Statistics
ISBN:9781319013387
Author:David S. Moore, George P. McCabe, Bruce A. Craig
Publisher:W. H. Freeman