MATLAB: An Introduction with Applications
6th Edition
ISBN: 9781119256830
Author: Amos Gilat
Publisher: John Wiley & Sons Inc
expand_more
expand_more
format_list_bulleted
Question

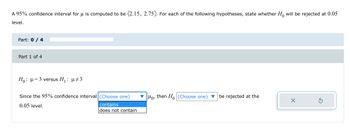
Transcribed Image Text:A 95% confidence interval for μ is computed to be (2.15, 2.75). For each of the following hypotheses, state whether Ho will be rejected at 0.05
level.
Part: 0 / 4
Part 1 of 4
Ho: μ = 3 versus H₁ : µ‡3
Since the 95% confidence interval (Choose one)
0.05 level.
contains
does not contain
Ho, then Ho (Choose one) be rejected at the
X
S

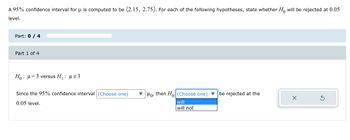
Transcribed Image Text:A 95% confidence interval for μ is computed to be (2.15, 2.75). For each of the following hypotheses, state whether Ho will be rejected at 0.05
level.
Part: 0 / 4
Part 1 of 4
H₁: μ = 3 versus H₁: µ‡3
Since the 95% confidence interval (Choose one)
0.05 level.
Mo, then Ho (Choose one) be rejected at the
will
will not
X
Expert Solution
This question has been solved!
Explore an expertly crafted, step-by-step solution for a thorough understanding of key concepts.
This is a popular solution
Trending nowThis is a popular solution!
Step by stepSolved in 2 steps

Knowledge Booster
Similar questions
- If n=29, x=35, and s=2, find the margin of error at a 95% confidence level using the critical value rounded to three decimal places. Give your answer as an equation or as a number rounded to three decimal places.arrow_forwardIf n=21, ¯x(x-bar)=31, and s=7, construct a confidence interval at a 99% confidence level. Assume the data came from a normally distributed population.Give your answers to one decimal place.< μ <arrow_forwardd, e and farrow_forward
- I need help with stats, section 7.2 and 7.3, please help with TI-84 calculator commands Test the claim about the population mean, μ, at the given level of significance using the given sample statistics. Claim: μ=40; α=0.01; σ=3.17. Sample statistics: x=38.1, n=72 Identify the null and alternative hypotheses. Write out the correct null and alternative hypotheses. Calculate the standardized test statistic: The standardized test statistic is ________________ (round to 2 decimal places as needed) Determin the critical value(s). Select the correct choice below and fill in the answer box to complete your choice. (round to 2 decimal places as needed) a. the critical value is ______________ b. the critical values are + _ ___________ Determine the outcome and conclusion of the test. Choose the correct answer below. A. fail to reject Ho. AT the 1% significane level, there is not enough evidence to reject the claim. B. fail to reject Ho. At the 1% significance…arrow_forwardTo construct a confidence interval for the difference between two population means μ₁ −μ2, use the form 0²2 0²/ 0²/2 + (x₁-x₂) -Zcarrow_forwardhelp please answer in text form with proper workings and explanation for each and every part and steps with concept and introduction no AI no copy paste remember answer must be in proper format with all workingarrow_forward- Construct the 99% confidence interval for the difference μ₁ −μ₂ when x₁=476.88, x₂=318.32, s₁=42.11, s₂=26.80, n₁=19, and n₂=22. Use tables to find the critical value and round the answers to at least two decimal places. A 99% confidence interval for the difference in the population means isarrow_forward20.19- 20.24arrow_forward品2 learn.zybooks.com DZL 4-3 Project One Submission -.. DZL 6-2 Participation Activities: Con... Z 5.2 - MAT 240: Applied Statistics DZL Module Five MAT 240: Applied Statistics home > 6.1: Confidence intervals E zyBooks CHALLENGE 6.1.1: Confidence intervals for population mean. ACTIVITY 389226.2543846.qx3zqy7 Jump to level 1 A clothing retailer is interested in the average waist size of men. A sample is taken with the results given below. Column1 Mean 41.32 Standard Error What is the sample statistic? = 41.32 C 1.447 Median 40 What is the point estimate for the average waist size? 41.32 Mode Standard Deviation 6.307 Sample Variance 39.78 What is the level of confidence as a decimal? Ex0.55 Kurtosis -0.79 Skewness 0.571 What is the margin of error? 2.509 Range Minimum 32 What is the confidence interval? [ Maximum 52 Sum 785 Count Confidence Level(90.0%) 60 LEGO Check Next References (*1) The Media Insight Project. "How Millennials Get News: Inside the Habits of America's First Digital…arrow_forward10.22 plsarrow_forwardHere are summary statistics for the weights of Pepsi in randomly selected cans: n=36, x=0.82412 lb, s=0.00573 lb. Use a confidence level of 95% to complete parts (a) through (d) below. Part 1 a. Identify the critical value tα/2 used for finding the margin of error. tα/2 = Part 2 b. Find the margin of error. Part 3 c. Find the confidence interval estimate of Part 4 d. Write a brief statement that interprets the confidence interval.arrow_forwardIf n=12, ¯x�¯(x-bar)=38, and s=19, construct a confidence interval at a 95% confidence level. Assume the data came from a normally distributed population.Give your answers to one decimal place. < μ� <arrow_forwardarrow_back_iosarrow_forward_iosRecommended textbooks for you
 MATLAB: An Introduction with ApplicationsStatisticsISBN:9781119256830Author:Amos GilatPublisher:John Wiley & Sons Inc
 Probability and Statistics for Engineering and th...StatisticsISBN:9781305251809Author:Jay L. DevorePublisher:Cengage Learning
 Statistics for The Behavioral Sciences (MindTap C...StatisticsISBN:9781305504912Author:Frederick J Gravetter, Larry B. WallnauPublisher:Cengage Learning
 Elementary Statistics: Picturing the World (7th E...StatisticsISBN:9780134683416Author:Ron Larson, Betsy FarberPublisher:PEARSON
 The Basic Practice of StatisticsStatisticsISBN:9781319042578Author:David S. Moore, William I. Notz, Michael A. FlignerPublisher:W. H. Freeman
 Introduction to the Practice of StatisticsStatisticsISBN:9781319013387Author:David S. Moore, George P. McCabe, Bruce A. CraigPublisher:W. H. Freeman
 MATLAB: An Introduction with ApplicationsStatisticsISBN:9781119256830Author:Amos GilatPublisher:John Wiley & Sons Inc
 Probability and Statistics for Engineering and th...StatisticsISBN:9781305251809Author:Jay L. DevorePublisher:Cengage Learning
 Statistics for The Behavioral Sciences (MindTap C...StatisticsISBN:9781305504912Author:Frederick J Gravetter, Larry B. WallnauPublisher:Cengage Learning
 Elementary Statistics: Picturing the World (7th E...StatisticsISBN:9780134683416Author:Ron Larson, Betsy FarberPublisher:PEARSON
 The Basic Practice of StatisticsStatisticsISBN:9781319042578Author:David S. Moore, William I. Notz, Michael A. FlignerPublisher:W. H. Freeman
 Introduction to the Practice of StatisticsStatisticsISBN:9781319013387Author:David S. Moore, George P. McCabe, Bruce A. CraigPublisher:W. H. Freeman