
MATLAB: An Introduction with Applications
6th Edition
ISBN: 9781119256830
Author: Amos Gilat
Publisher: John Wiley & Sons Inc
expand_more
expand_more
format_list_bulleted
Related questions
Question
Z?
for the last part for b is it disagree or agree inside or outside? thank you
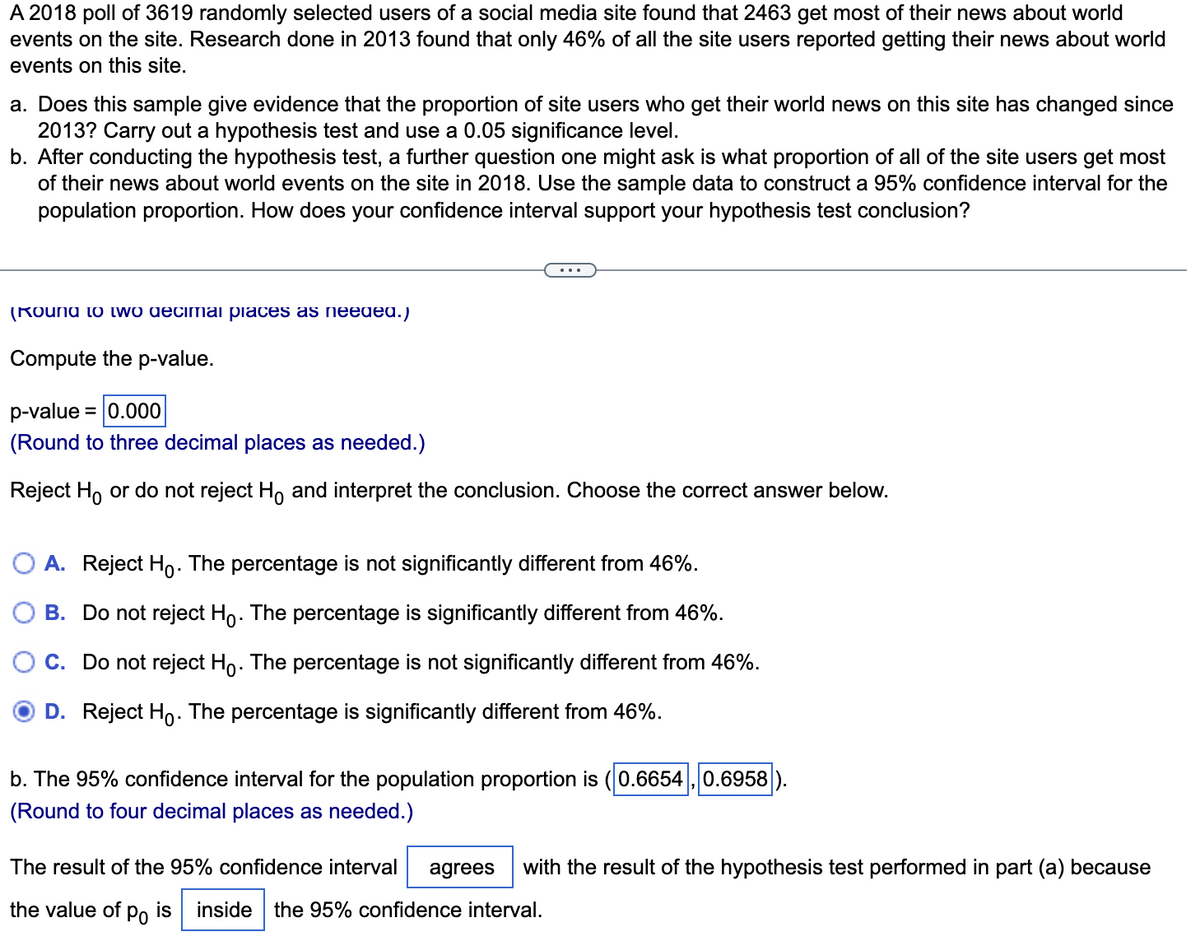

Transcribed Image Text:A 2018 poll of 3619 randomly selected users of a social media site found that 2463 get most of their news about world
events on the site. Research done in 2013 found that only 46% of all the site users reported getting their news about world
events on this site.
a. Does this sample give evidence that the proportion of site users who get their world news on this site has changed since
2013? Carry out a hypothesis test and use a 0.05 significance level.
b. After conducting the hypothesis test, a further question one might ask is what proportion of all of the site users get most
of their news about world events on the site in 2018. Use the sample data to construct a 95% confidence interval for the
population proportion. How does your confidence interval support your hypothesis test conclusion?
(Round to two decimal places as needed.)
Compute the p-value.
p-value = 0.000
(Round to three decimal places as needed.)
Reject Ho or do not reject Ho and interpret the conclusion. Choose the correct answer below.
A. Reject Ho. The percentage is not significantly different from 46%.
B. Do not reject Ho. The percentage is significantly different from 46%.
C. Do not reject Ho. The percentage is not significantly different from 46%.
O D. Reject Ho. The percentage is significantly different from 46%.
b. The 95% confidence interval for the population proportion is (0.6654, 0.6958
(Round to four decimal places as needed.)
The result of the 95% confidence interval agrees with the result of the hypothesis test performed in part (a) because
the value of po is inside the 95% confidence interval.

Transcribed Image Text:A 2018 poll of 3619 randomly selected users of a social media site found that 2463 get most of their news about world
events on the site. Research done in 2013 found that only 46% of all the site users reported getting their news about world
events on this site.
a. Does this sample give evidence that the proportion of site users who get their world news on this site has changed since
2013? Carry out a hypothesis test and use a 0.05 significance level.
b. After conducting the hypothesis test, a further question one might ask is what proportion of all of the site users get most
of their news about world events on the site in 2018. Use the sample data to construct a 95% confidence interval for the
population proportion. How does your confidence interval support your hypothesis test conclusion?
a. State the null and alternative hypotheses. Let p be the proportion of site users who get their world news on the site.
Ho: p =
0.46
H₂:p #
0.46
(Type integers or decimals. Do not round.)
Compute the z-test statistic.
Z=
(Round to two decimal places as needed.)
Compute the p-value.
p-value = 0.000
(Round to three decimal places as needed.)
Reject Ho or do not reject Ho and interpret the conclusion. Choose the correct answer below.
Expert Solution
This question has been solved!
Explore an expertly crafted, step-by-step solution for a thorough understanding of key concepts.

This is a popular solution

Trending nowThis is a popular solution!

Step by stepSolved in 3 steps with 2 images

Knowledge Booster

Similar questions
- 7. Circle the appropriate word that will complete the sentence involving A ÷ B:arrow_forwardStephanie sells 12 pretzels per hour. Robert sells 15 pretzels per hour. This week, Robert sold an additional 18 pretzels. Which of the following expressions represents the total sales of both people this week, where S represents the number of hours that Stephanie worked and R represents the numbers the number of hours that Robert worked?arrow_forwardFind the total area of the shaded regions. 25 y=x√ 25-x² 20- N -8 -6 -4 -2 15- 10- LO 5- 15- -10 -15- -20- -25 y 2 4 6 00 ... The total area of the shaded regions is. (Simplify your answer.)arrow_forward
arrow_back_ios
arrow_forward_ios
Recommended textbooks for you
- MATLAB: An Introduction with ApplicationsStatisticsISBN:9781119256830Author:Amos GilatPublisher:John Wiley & Sons Inc
 Probability and Statistics for Engineering and th...StatisticsISBN:9781305251809Author:Jay L. DevorePublisher:Cengage Learning
 Statistics for The Behavioral Sciences (MindTap C...StatisticsISBN:9781305504912Author:Frederick J Gravetter, Larry B. WallnauPublisher:Cengage Learning
  Elementary Statistics: Picturing the World (7th E...StatisticsISBN:9780134683416Author:Ron Larson, Betsy FarberPublisher:PEARSON
 The Basic Practice of StatisticsStatisticsISBN:9781319042578Author:David S. Moore, William I. Notz, Michael A. FlignerPublisher:W. H. Freeman
 Introduction to the Practice of StatisticsStatisticsISBN:9781319013387Author:David S. Moore, George P. McCabe, Bruce A. CraigPublisher:W. H. Freeman
MATLAB: An Introduction with Applications
Statistics
ISBN:9781119256830
Author:Amos Gilat
Publisher:John Wiley & Sons Inc
Probability and Statistics for Engineering and th...
Statistics
ISBN:9781305251809
Author:Jay L. Devore
Publisher:Cengage Learning
Statistics for The Behavioral Sciences (MindTap C...
Statistics
ISBN:9781305504912
Author:Frederick J Gravetter, Larry B. Wallnau
Publisher:Cengage Learning
Elementary Statistics: Picturing the World (7th E...
Statistics
ISBN:9780134683416
Author:Ron Larson, Betsy Farber
Publisher:PEARSON
The Basic Practice of Statistics
Statistics
ISBN:9781319042578
Author:David S. Moore, William I. Notz, Michael A. Fligner
Publisher:W. H. Freeman
Introduction to the Practice of Statistics
Statistics
ISBN:9781319013387
Author:David S. Moore, George P. McCabe, Bruce A. Craig
Publisher:W. H. Freeman