Structural Analysis
Structural Analysis
6th Edition
ISBN: 9781337630931
Author: KASSIMALI, Aslam.
Publisher: Cengage,
Bartleby Related Questions Icon

Related questions

bartleby

Concept explainers

Question
100%

I need detailed explanation to solve the exercise below. There are some formulas and hints, I also added some tables from the book.
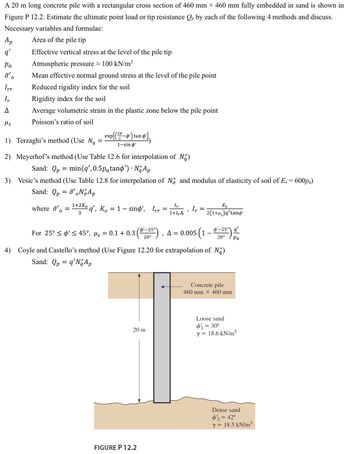
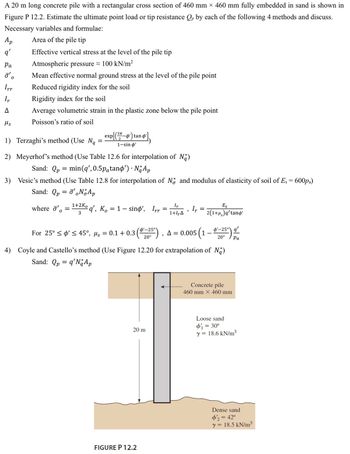
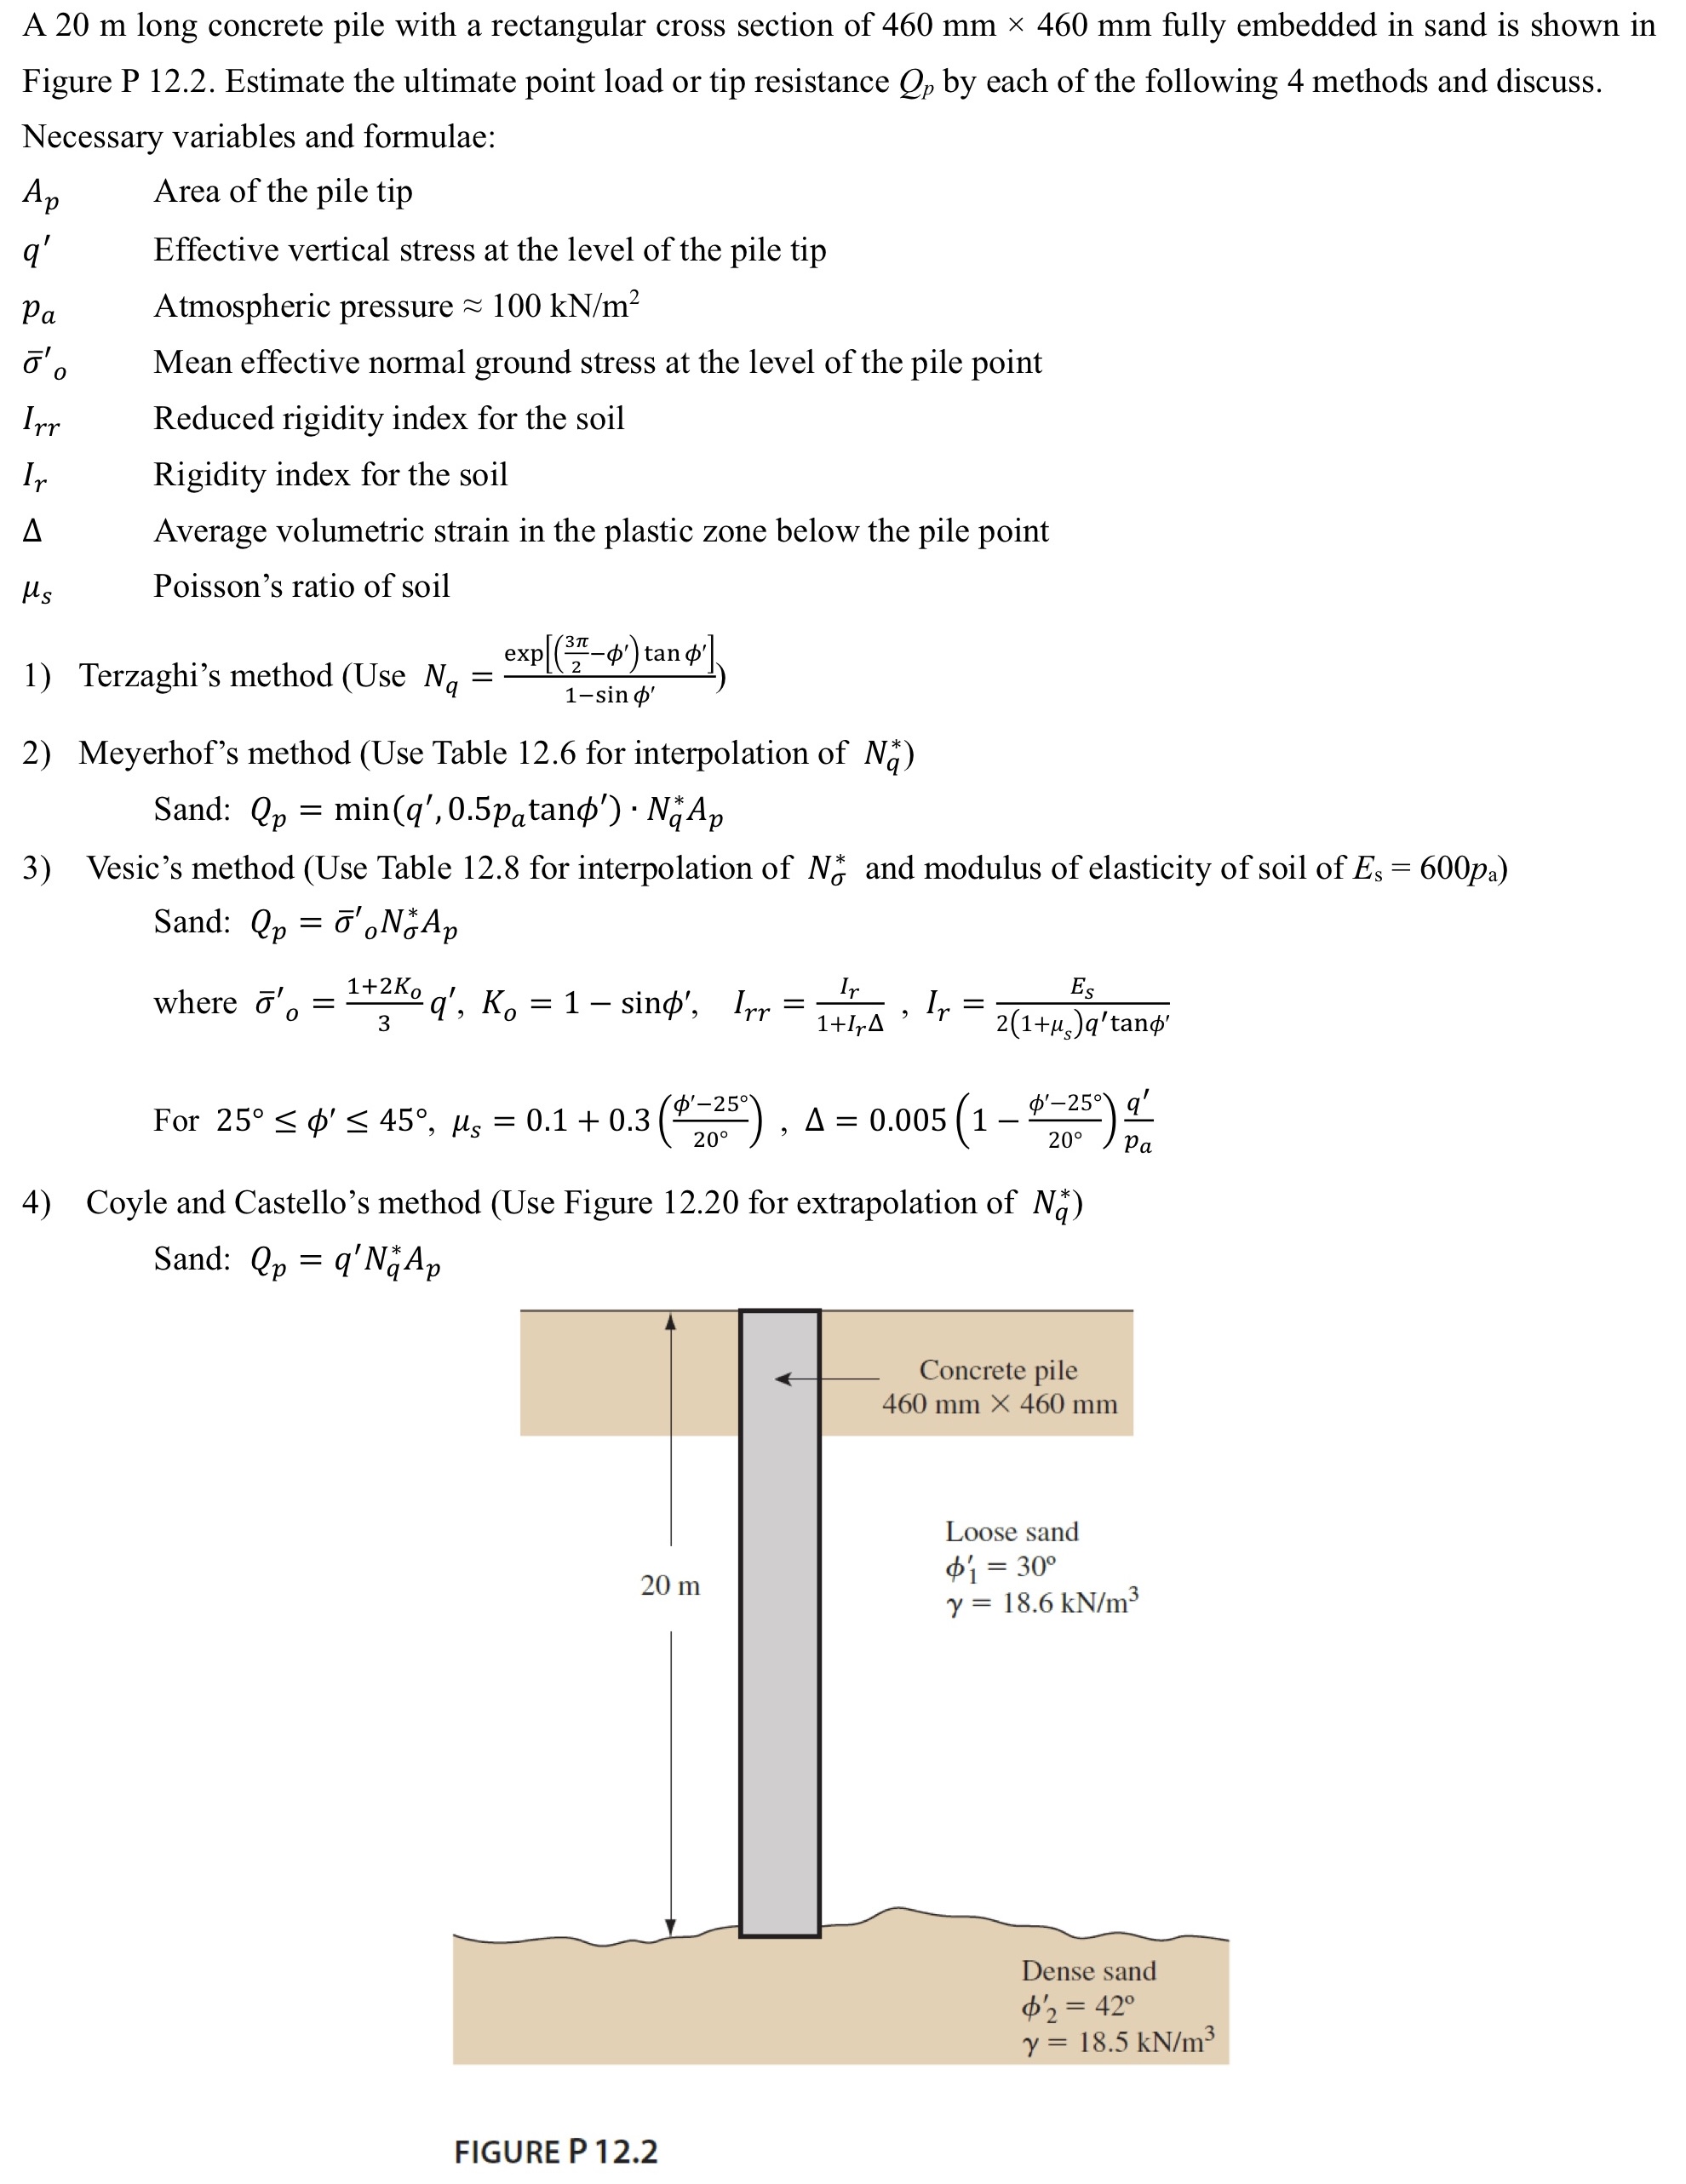
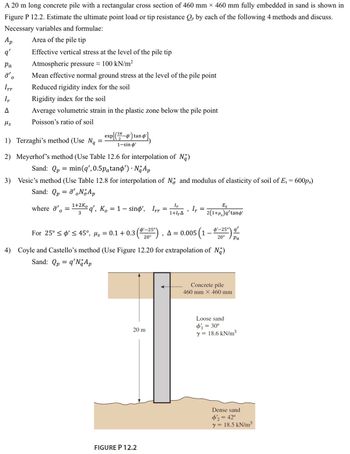
A 20 m long concrete pile with a rectangular cross section of 460 mm × 460 mm fully embedded in sand is shown in
Figure P 12.2. Estimate the ultimate point load or tip resistance Qp by each of the following 4 methods and discuss.
Necessary variables and formulae:
Area of the pile tip
Effective vertical stress at the level of the pile tip
Atmospheric pressure 100 kN/m²
Ap
q'
Pa
o'o
Irr
Ir
A
Ms
Mean effective normal ground stress at the level of the pile point
Reduced rigidity index for the soil
Rigidity index for the soil
Average volumetric strain in the plastic zone below the pile point
Poisson's ratio of soil
1) Terzaghi's method (Use Ng
=
2) Meyerhof's method (Use Table 12.6 for interpolation of Na)
Sand: Qp = min (q', 0.5påtanp') · Nä Ap
3) Vesic's method (Use Table 12.8 for interpolation of N and modulus of elasticity of soil of Es = 600pa)
Sand: Qp = ō'。No Ap
where ' =
0
exp[(37-4¹) tan d'
2
1-sin o'
1+2Ko
3
q', K. = 1 - sino', Irr
=
20 m
Ir
1+1,Δ
FIGURE P 12.2
9
Ir
=
For 25° ≤ ø' ≤ 45°, µs = 0.1 +0.3 (25¹), A = 0.005 (1 – $¹_25")
'-25°
q'
{
20°
20° Pa
Es
2(1+μ) q' tand'
4) Coyle and Castello's method (Use Figure 12.20 for extrapolation of Na)
Sand: Qp = q'N Ap
Concrete pile
460 mm x 460 mm
Loose sand
φί = 30°
y = 18.6 kN/m³
Dense sand
$'2 = 42°
y = 18.5 kN/m³
expand button
Transcribed Image Text:A 20 m long concrete pile with a rectangular cross section of 460 mm × 460 mm fully embedded in sand is shown in Figure P 12.2. Estimate the ultimate point load or tip resistance Qp by each of the following 4 methods and discuss. Necessary variables and formulae: Area of the pile tip Effective vertical stress at the level of the pile tip Atmospheric pressure 100 kN/m² Ap q' Pa o'o Irr Ir A Ms Mean effective normal ground stress at the level of the pile point Reduced rigidity index for the soil Rigidity index for the soil Average volumetric strain in the plastic zone below the pile point Poisson's ratio of soil 1) Terzaghi's method (Use Ng = 2) Meyerhof's method (Use Table 12.6 for interpolation of Na) Sand: Qp = min (q', 0.5påtanp') · Nä Ap 3) Vesic's method (Use Table 12.8 for interpolation of N and modulus of elasticity of soil of Es = 600pa) Sand: Qp = ō'。No Ap where ' = 0 exp[(37-4¹) tan d' 2 1-sin o' 1+2Ko 3 q', K. = 1 - sino', Irr = 20 m Ir 1+1,Δ FIGURE P 12.2 9 Ir = For 25° ≤ ø' ≤ 45°, µs = 0.1 +0.3 (25¹), A = 0.005 (1 – $¹_25") '-25° q' { 20° 20° Pa Es 2(1+μ) q' tand' 4) Coyle and Castello's method (Use Figure 12.20 for extrapolation of Na) Sand: Qp = q'N Ap Concrete pile 460 mm x 460 mm Loose sand φί = 30° y = 18.6 kN/m³ Dense sand $'2 = 42° y = 18.5 kN/m³
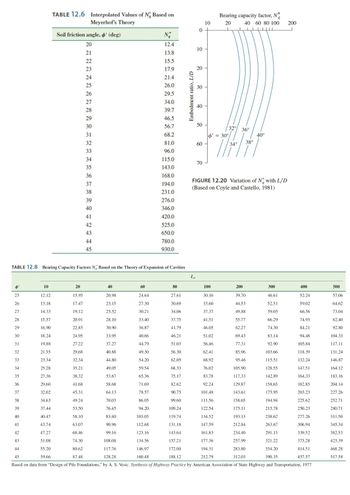
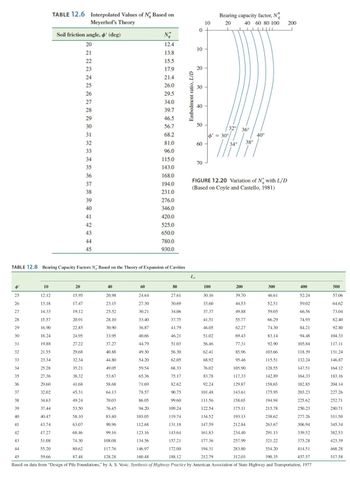
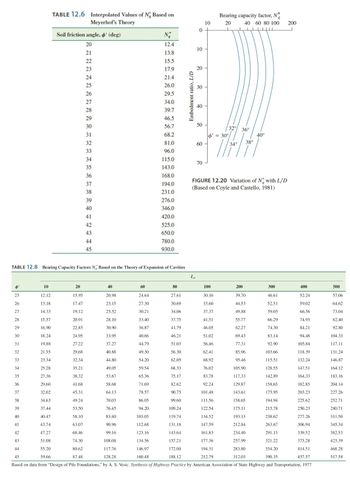
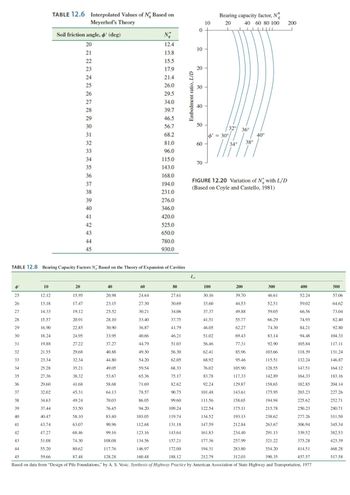
TABLE 12.6 Interpolated Values of Ng Based on
Meyerhof's Theory
25
26
27
28
29
Soil friction angle, ø' (deg)
20
21
22
23
24
25
26
27
28
29
30
31
32
33
34
35
36
37
38
10
39
40
41
42
43
20
44
45
TABLE 12.8 Bearing Capacity Factors No Based on the Theory of Expansion of Cavities
15.95
17.47
19.12
20.91
22.85
24.95
27.22
29.68
32.34
35.21
38.32
41.68
45.31
49.24
53.50
58.10
63.07
68.46
74.30
80.62
87.48
N₂
12.4
13.8
15.5
17.9
21.4
26.0
29.5
34.0
39.7
46.5
56.7
68.2
81.0
96.0
40
115.0
143.0
168.0
194.0
231.0
60
276.0
346.0
420.0
525.0
650.0
780.0
930.0
Embedment ratio, L/D
0
ITT
10
20
30
40
50
60
70
10
T
T
T
Bearing capacity factor, N*
9
20
40 60 80 100
$' = 30°
80
300
400
12.12
20.98
24.64
27.61
39.70
46.61
52.24
13.18
23.15
27.30
30.69
44.53
52.51
59.02
14.33
25.52
30.21
34.06
49.88
59.05
66.56
15.57
28.10
33.40
37.75
55.77
66.29
74.93
16.90
30.90
36.87
41.79
62.27
74.30
84.21
30
18.24
33.95
40.66
46.21
69.43
83.14
94.48
31
19.88
37.27
44.79
51.03
77.31
92.90
105.84
32
21.55
40.88
49.30
56.30
85.96
103.66
118.39
33
23.34
44.80
54.20
62.05
95.46
115.51
132.24
34
25.28
49.05
59.54
68.33
105.90
128.55
147.51
35
27.36
53.67
65.36
75.17
117.33
142.89
164.33
36
29.60
58.68
71.69
82.62
129.87
158.65
182.85
37
32.02
64.13
78.57
90.75
143.61
175.95
203.23
38
34.63
70.03
86.05
99.60
158.65
194.94
225.62
39
37.44
76.45
94.20
109.24
175.11
215.78
250.23
40
40.47
83.40
103.05
119.74
193.13
238.62
277.26
41
43.74
90.96
112.68
131.18
212.84
263.67
306.94
42
47.27
99.16
123.16
143.64
234.40
291.13
339.52
43
51.08
108.08
134.56
157.21
257.99
321.22
375.28
44
55.20
117.76
146.97
172.00
283.80
354.20
414.51
45
59.66
128.28
160.48
188.12
312.03
390.35
457.57
Based on data from "Design of Pile Foundations," by A. S. Vesic. Synthesis of Highway Practice by American Association of State Highway and Transportation, 1977
32° 36°
100
30.16
33.60
37.37
41.51
46.05
51.02
56.46
62.41
68.92
76.02
83.78
92.24
101.48
111.56
122.54
134.52
147.59
161.83
177.36
194.31
212.79
34°
FIGURE 12.20 Variation of N with L/D
(Based on Coyle and Castello, 1981)
38°
40°
200
200
500
57.06
64.62
73.04
82.40
92.80
104.33
117.11
131.24
146.87
164.12
183.16
204.14
227.26
252.71
280.71
311.50
345.34
382.53
423.39
468.28
517.58
expand button
Transcribed Image Text:TABLE 12.6 Interpolated Values of Ng Based on Meyerhof's Theory 25 26 27 28 29 Soil friction angle, ø' (deg) 20 21 22 23 24 25 26 27 28 29 30 31 32 33 34 35 36 37 38 10 39 40 41 42 43 20 44 45 TABLE 12.8 Bearing Capacity Factors No Based on the Theory of Expansion of Cavities 15.95 17.47 19.12 20.91 22.85 24.95 27.22 29.68 32.34 35.21 38.32 41.68 45.31 49.24 53.50 58.10 63.07 68.46 74.30 80.62 87.48 N₂ 12.4 13.8 15.5 17.9 21.4 26.0 29.5 34.0 39.7 46.5 56.7 68.2 81.0 96.0 40 115.0 143.0 168.0 194.0 231.0 60 276.0 346.0 420.0 525.0 650.0 780.0 930.0 Embedment ratio, L/D 0 ITT 10 20 30 40 50 60 70 10 T T T Bearing capacity factor, N* 9 20 40 60 80 100 $' = 30° 80 300 400 12.12 20.98 24.64 27.61 39.70 46.61 52.24 13.18 23.15 27.30 30.69 44.53 52.51 59.02 14.33 25.52 30.21 34.06 49.88 59.05 66.56 15.57 28.10 33.40 37.75 55.77 66.29 74.93 16.90 30.90 36.87 41.79 62.27 74.30 84.21 30 18.24 33.95 40.66 46.21 69.43 83.14 94.48 31 19.88 37.27 44.79 51.03 77.31 92.90 105.84 32 21.55 40.88 49.30 56.30 85.96 103.66 118.39 33 23.34 44.80 54.20 62.05 95.46 115.51 132.24 34 25.28 49.05 59.54 68.33 105.90 128.55 147.51 35 27.36 53.67 65.36 75.17 117.33 142.89 164.33 36 29.60 58.68 71.69 82.62 129.87 158.65 182.85 37 32.02 64.13 78.57 90.75 143.61 175.95 203.23 38 34.63 70.03 86.05 99.60 158.65 194.94 225.62 39 37.44 76.45 94.20 109.24 175.11 215.78 250.23 40 40.47 83.40 103.05 119.74 193.13 238.62 277.26 41 43.74 90.96 112.68 131.18 212.84 263.67 306.94 42 47.27 99.16 123.16 143.64 234.40 291.13 339.52 43 51.08 108.08 134.56 157.21 257.99 321.22 375.28 44 55.20 117.76 146.97 172.00 283.80 354.20 414.51 45 59.66 128.28 160.48 188.12 312.03 390.35 457.57 Based on data from "Design of Pile Foundations," by A. S. Vesic. Synthesis of Highway Practice by American Association of State Highway and Transportation, 1977 32° 36° 100 30.16 33.60 37.37 41.51 46.05 51.02 56.46 62.41 68.92 76.02 83.78 92.24 101.48 111.56 122.54 134.52 147.59 161.83 177.36 194.31 212.79 34° FIGURE 12.20 Variation of N with L/D (Based on Coyle and Castello, 1981) 38° 40° 200 200 500 57.06 64.62 73.04 82.40 92.80 104.33 117.11 131.24 146.87 164.12 183.16 204.14 227.26 252.71 280.71 311.50 345.34 382.53 423.39 468.28 517.58
Expert Solution
Check Mark
Still need help?
Follow-up Questions
Read through expert solutions to related follow-up questions below.
Follow-up Question

I need detailed explanation to solve the exercise below. There are some formulas and hints, I also added some tables from the book.
Meyerhof's method, Coyle and Castello's method and Vesic's method were already solved.
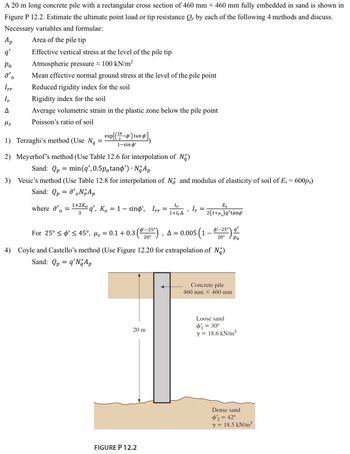
A 20 m long concrete pile with a rectangular cross section of 460 mm × 460 mm fully embedded in sand is shown in
Figure P 12.2. Estimate the ultimate point load or tip resistance Qp by each of the following 4 methods and discuss.
Necessary variables and formulae:
Area of the pile tip
Effective vertical stress at the level of the pile tip
Atmospheric pressure 100 kN/m²
Ap
q'
Pa
o'o
Irr
Ir
A
Ms
Mean effective normal ground stress at the level of the pile point
Reduced rigidity index for the soil
Rigidity index for the soil
Average volumetric strain in the plastic zone below the pile point
Poisson's ratio of soil
1) Terzaghi's method (Use Ng
=
2) Meyerhof's method (Use Table 12.6 for interpolation of Na)
Sand: Qp = min (q', 0.5påtanp') · No Ap
3) Vesic's method (Use Table 12.8 for interpolation of N and modulus of elasticity of soil of Es = 600pa)
Sand: Qp = ¯'。No Ap
where ' =
0
exp[(37-4¹) tand
2
1-sin o'
1+2Ko
3
q', K. = 1 - sino', Irr
=
20 m
Ir
1+1,Δ
FIGURE P 12.2
9
Ir
=
For 25° ≤ ø' ≤ 45°, µs = 0.1 +0.3 (25¹), A = 0.005 (1 – $¹_25")
'-25°
q'
{
20°
20° Pa
Es
2(1+μ₂)q'tand'
4) Coyle and Castello's method (Use Figure 12.20 for extrapolation of Na)
Sand: Qp = q'N Ap
Concrete pile
460 mm X 460 mm
Loose sand
φί = 30°
y = 18.6 kN/m³
Dense sand
$'2 = 42°
y = 18.5 kN/m³
expand button
Transcribed Image Text:A 20 m long concrete pile with a rectangular cross section of 460 mm × 460 mm fully embedded in sand is shown in Figure P 12.2. Estimate the ultimate point load or tip resistance Qp by each of the following 4 methods and discuss. Necessary variables and formulae: Area of the pile tip Effective vertical stress at the level of the pile tip Atmospheric pressure 100 kN/m² Ap q' Pa o'o Irr Ir A Ms Mean effective normal ground stress at the level of the pile point Reduced rigidity index for the soil Rigidity index for the soil Average volumetric strain in the plastic zone below the pile point Poisson's ratio of soil 1) Terzaghi's method (Use Ng = 2) Meyerhof's method (Use Table 12.6 for interpolation of Na) Sand: Qp = min (q', 0.5påtanp') · No Ap 3) Vesic's method (Use Table 12.8 for interpolation of N and modulus of elasticity of soil of Es = 600pa) Sand: Qp = ¯'。No Ap where ' = 0 exp[(37-4¹) tand 2 1-sin o' 1+2Ko 3 q', K. = 1 - sino', Irr = 20 m Ir 1+1,Δ FIGURE P 12.2 9 Ir = For 25° ≤ ø' ≤ 45°, µs = 0.1 +0.3 (25¹), A = 0.005 (1 – $¹_25") '-25° q' { 20° 20° Pa Es 2(1+μ₂)q'tand' 4) Coyle and Castello's method (Use Figure 12.20 for extrapolation of Na) Sand: Qp = q'N Ap Concrete pile 460 mm X 460 mm Loose sand φί = 30° y = 18.6 kN/m³ Dense sand $'2 = 42° y = 18.5 kN/m³
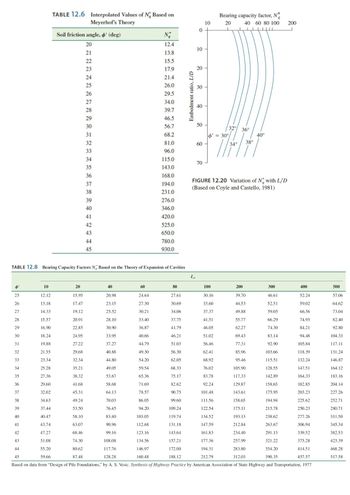
TABLE 12.6 Interpolated Values of Ng Based on
Meyerhof's Theory
25
26
27
28
29
Soil friction angle, ø' (deg)
20
21
22
23
24
25
26
27
28
29
30
31
32
33
34
35
36
37
38
10
39
40
41
42
43
20
44
45
TABLE 12.8 Bearing Capacity Factors N. Based on the Theory of Expansion of Cavities
15.95
17.47
19.12
20.91
22.85
24.95
27.22
29.68
32.34
35.21
38.32
41.68
45.31
49.24
53.50
58.10
63.07
68.46
74.30
80.62
87.48
N₂
12.4
13.8
15.5
17.9
21.4
26.0
29.5
34.0
39.7
46.5
56.7
68.2
81.0
96.0
40
115.0
143.0
168.0
194.0
231.0
60
276.0
346.0
420.0
525.0
650.0
780.0
930.0
Embedment ratio, L/D
0
ITT
10
20
30
40
50
60
70
10
T
T
T
Bearing capacity factor, N*
9
20
40 60 80 100
$' = 30°
80
300
400
12.12
20.98
24.64
27.61
39.70
46.61
52.24
13.18
23.15
27.30
30.69
44.53
52.51
59.02
14.33
25.52
30.21
34.06
49.88
59.05
66.56
15.57
28.10
33.40
37.75
55.77
66.29
74.93
16.90
30.90
36.87
41.79
62.27
74.30
84.21
30
18.24
33.95
40.66
46.21
69.43
83.14
94.48
31
19.88
37.27
44.79
51.03
77.31
92.90
105.84
32
21.55
40.88
49.30
56.30
85.96
103.66
118.39
33
23.34
44.80
54.20
62.05
95.46
115.51
132.24
34
25.28
49.05
59.54
68.33
105.90
128.55
147.51
35
27.36
53.67
65.36
75.17
117.33
142.89
164.33
36
29.60
58.68
71.69
82.62
129.87
158.65
182.85
37
32.02
64.13
78.57
90.75
143.61
175.95
203.23
38
34.63
70.03
86.05
99.60
158.65
194.94
225.62
39
37.44
76.45
94.20
109.24
175.11
215.78
250.23
40
40.47
83.40
103.05
119.74
193.13
238.62
277.26
41
43.74
90.96
112.68
131.18
212.84
263.67
306.94
42
47.27
99.16
123.16
143.64
234.40
291.13
339.52
43
51.08
108.08
134.56
157.21
257.99
321.22
375.28
44
55.20
117.76
146.97
172.00
283.80
354.20
414.51
45
59.66
128.28
160.48
188.12
312.03
390.35
457.57
Based on data from "Design of Pile Foundations," by A. S. Vesic. Synthesis of Highway Practice by American Association of State Highway and Transportation, 1977
32° 36°
100
30.16
33.60
37.37
41.51
46.05
51.02
56.46
62.41
68.92
76.02
83.78
92.24
101.48
111.56
122.54
134.52
147.59
161.83
177.36
194.31
212.79
34°
FIGURE 12.20 Variation of N with L/D
(Based on Coyle and Castello, 1981)
38°
40°
200
200
500
57.06
64.62
73.04
82.40
92.80
104.33
117.11
131.24
146.87
164.12
183.16
204.14
227.26
252.71
280.71
311.50
345.34
382.53
423.39
468.28
517.58
expand button
Transcribed Image Text:TABLE 12.6 Interpolated Values of Ng Based on Meyerhof's Theory 25 26 27 28 29 Soil friction angle, ø' (deg) 20 21 22 23 24 25 26 27 28 29 30 31 32 33 34 35 36 37 38 10 39 40 41 42 43 20 44 45 TABLE 12.8 Bearing Capacity Factors N. Based on the Theory of Expansion of Cavities 15.95 17.47 19.12 20.91 22.85 24.95 27.22 29.68 32.34 35.21 38.32 41.68 45.31 49.24 53.50 58.10 63.07 68.46 74.30 80.62 87.48 N₂ 12.4 13.8 15.5 17.9 21.4 26.0 29.5 34.0 39.7 46.5 56.7 68.2 81.0 96.0 40 115.0 143.0 168.0 194.0 231.0 60 276.0 346.0 420.0 525.0 650.0 780.0 930.0 Embedment ratio, L/D 0 ITT 10 20 30 40 50 60 70 10 T T T Bearing capacity factor, N* 9 20 40 60 80 100 $' = 30° 80 300 400 12.12 20.98 24.64 27.61 39.70 46.61 52.24 13.18 23.15 27.30 30.69 44.53 52.51 59.02 14.33 25.52 30.21 34.06 49.88 59.05 66.56 15.57 28.10 33.40 37.75 55.77 66.29 74.93 16.90 30.90 36.87 41.79 62.27 74.30 84.21 30 18.24 33.95 40.66 46.21 69.43 83.14 94.48 31 19.88 37.27 44.79 51.03 77.31 92.90 105.84 32 21.55 40.88 49.30 56.30 85.96 103.66 118.39 33 23.34 44.80 54.20 62.05 95.46 115.51 132.24 34 25.28 49.05 59.54 68.33 105.90 128.55 147.51 35 27.36 53.67 65.36 75.17 117.33 142.89 164.33 36 29.60 58.68 71.69 82.62 129.87 158.65 182.85 37 32.02 64.13 78.57 90.75 143.61 175.95 203.23 38 34.63 70.03 86.05 99.60 158.65 194.94 225.62 39 37.44 76.45 94.20 109.24 175.11 215.78 250.23 40 40.47 83.40 103.05 119.74 193.13 238.62 277.26 41 43.74 90.96 112.68 131.18 212.84 263.67 306.94 42 47.27 99.16 123.16 143.64 234.40 291.13 339.52 43 51.08 108.08 134.56 157.21 257.99 321.22 375.28 44 55.20 117.76 146.97 172.00 283.80 354.20 414.51 45 59.66 128.28 160.48 188.12 312.03 390.35 457.57 Based on data from "Design of Pile Foundations," by A. S. Vesic. Synthesis of Highway Practice by American Association of State Highway and Transportation, 1977 32° 36° 100 30.16 33.60 37.37 41.51 46.05 51.02 56.46 62.41 68.92 76.02 83.78 92.24 101.48 111.56 122.54 134.52 147.59 161.83 177.36 194.31 212.79 34° FIGURE 12.20 Variation of N with L/D (Based on Coyle and Castello, 1981) 38° 40° 200 200 500 57.06 64.62 73.04 82.40 92.80 104.33 117.11 131.24 146.87 164.12 183.16 204.14 227.26 252.71 280.71 311.50 345.34 382.53 423.39 468.28 517.58
Solution
Bartleby Expert
by Bartleby Expert
SEE SOLUTION
Follow-up Question

I need detailed explanation to solve the exercise below. There are some formulas and hints, I also added some tables from the book.
Meyerhof's method, Coyle and Castello's method and Vesic's method were already solved.
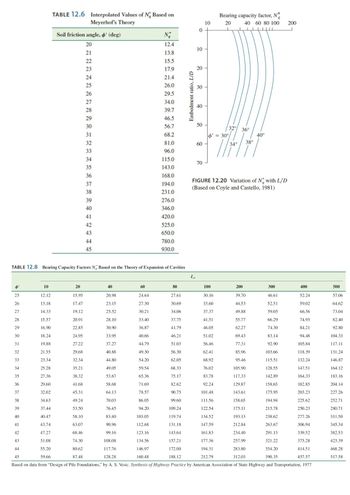
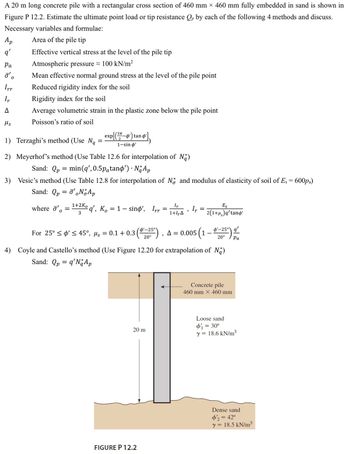
TABLE 12.6 Interpolated Values of Ng Based on
Meyerhof's Theory
25
26
27
28
29
Soil friction angle, ø' (deg)
20
21
22
23
24
25
26
27
28
29
30
31
32
33
34
35
36
37
38
10
39
40
41
42
43
20
44
45
TABLE 12.8 Bearing Capacity Factors N. Based on the Theory of Expansion of Cavities
15.95
17.47
19.12
20.91
22.85
24.95
27.22
29.68
32.34
35.21
38.32
41.68
45.31
49.24
53.50
58.10
63.07
68.46
74.30
80.62
87.48
N₂
12.4
13.8
15.5
17.9
21.4
26.0
29.5
34.0
39.7
46.5
56.7
68.2
81.0
96.0
40
115.0
143.0
168.0
194.0
231.0
60
276.0
346.0
420.0
525.0
650.0
780.0
930.0
Embedment ratio, L/D
0
ITT
10
20
30
40
50
60
70
10
T
T
T
Bearing capacity factor, N*
9
20
40 60 80 100
$' = 30°
80
300
400
12.12
20.98
24.64
27.61
39.70
46.61
52.24
13.18
23.15
27.30
30.69
44.53
52.51
59.02
14.33
25.52
30.21
34.06
49.88
59.05
66.56
15.57
28.10
33.40
37.75
55.77
66.29
74.93
16.90
30.90
36.87
41.79
62.27
74.30
84.21
30
18.24
33.95
40.66
46.21
69.43
83.14
94.48
31
19.88
37.27
44.79
51.03
77.31
92.90
105.84
32
21.55
40.88
49.30
56.30
85.96
103.66
118.39
33
23.34
44.80
54.20
62.05
95.46
115.51
132.24
34
25.28
49.05
59.54
68.33
105.90
128.55
147.51
35
27.36
53.67
65.36
75.17
117.33
142.89
164.33
36
29.60
58.68
71.69
82.62
129.87
158.65
182.85
37
32.02
64.13
78.57
90.75
143.61
175.95
203.23
38
34.63
70.03
86.05
99.60
158.65
194.94
225.62
39
37.44
76.45
94.20
109.24
175.11
215.78
250.23
40
40.47
83.40
103.05
119.74
193.13
238.62
277.26
41
43.74
90.96
112.68
131.18
212.84
263.67
306.94
42
47.27
99.16
123.16
143.64
234.40
291.13
339.52
43
51.08
108.08
134.56
157.21
257.99
321.22
375.28
44
55.20
117.76
146.97
172.00
283.80
354.20
414.51
45
59.66
128.28
160.48
188.12
312.03
390.35
457.57
Based on data from "Design of Pile Foundations," by A. S. Vesic. Synthesis of Highway Practice by American Association of State Highway and Transportation, 1977
32° 36°
100
30.16
33.60
37.37
41.51
46.05
51.02
56.46
62.41
68.92
76.02
83.78
92.24
101.48
111.56
122.54
134.52
147.59
161.83
177.36
194.31
212.79
34°
FIGURE 12.20 Variation of N with L/D
(Based on Coyle and Castello, 1981)
38°
40°
200
200
500
57.06
64.62
73.04
82.40
92.80
104.33
117.11
131.24
146.87
164.12
183.16
204.14
227.26
252.71
280.71
311.50
345.34
382.53
423.39
468.28
517.58
expand button
Transcribed Image Text:TABLE 12.6 Interpolated Values of Ng Based on Meyerhof's Theory 25 26 27 28 29 Soil friction angle, ø' (deg) 20 21 22 23 24 25 26 27 28 29 30 31 32 33 34 35 36 37 38 10 39 40 41 42 43 20 44 45 TABLE 12.8 Bearing Capacity Factors N. Based on the Theory of Expansion of Cavities 15.95 17.47 19.12 20.91 22.85 24.95 27.22 29.68 32.34 35.21 38.32 41.68 45.31 49.24 53.50 58.10 63.07 68.46 74.30 80.62 87.48 N₂ 12.4 13.8 15.5 17.9 21.4 26.0 29.5 34.0 39.7 46.5 56.7 68.2 81.0 96.0 40 115.0 143.0 168.0 194.0 231.0 60 276.0 346.0 420.0 525.0 650.0 780.0 930.0 Embedment ratio, L/D 0 ITT 10 20 30 40 50 60 70 10 T T T Bearing capacity factor, N* 9 20 40 60 80 100 $' = 30° 80 300 400 12.12 20.98 24.64 27.61 39.70 46.61 52.24 13.18 23.15 27.30 30.69 44.53 52.51 59.02 14.33 25.52 30.21 34.06 49.88 59.05 66.56 15.57 28.10 33.40 37.75 55.77 66.29 74.93 16.90 30.90 36.87 41.79 62.27 74.30 84.21 30 18.24 33.95 40.66 46.21 69.43 83.14 94.48 31 19.88 37.27 44.79 51.03 77.31 92.90 105.84 32 21.55 40.88 49.30 56.30 85.96 103.66 118.39 33 23.34 44.80 54.20 62.05 95.46 115.51 132.24 34 25.28 49.05 59.54 68.33 105.90 128.55 147.51 35 27.36 53.67 65.36 75.17 117.33 142.89 164.33 36 29.60 58.68 71.69 82.62 129.87 158.65 182.85 37 32.02 64.13 78.57 90.75 143.61 175.95 203.23 38 34.63 70.03 86.05 99.60 158.65 194.94 225.62 39 37.44 76.45 94.20 109.24 175.11 215.78 250.23 40 40.47 83.40 103.05 119.74 193.13 238.62 277.26 41 43.74 90.96 112.68 131.18 212.84 263.67 306.94 42 47.27 99.16 123.16 143.64 234.40 291.13 339.52 43 51.08 108.08 134.56 157.21 257.99 321.22 375.28 44 55.20 117.76 146.97 172.00 283.80 354.20 414.51 45 59.66 128.28 160.48 188.12 312.03 390.35 457.57 Based on data from "Design of Pile Foundations," by A. S. Vesic. Synthesis of Highway Practice by American Association of State Highway and Transportation, 1977 32° 36° 100 30.16 33.60 37.37 41.51 46.05 51.02 56.46 62.41 68.92 76.02 83.78 92.24 101.48 111.56 122.54 134.52 147.59 161.83 177.36 194.31 212.79 34° FIGURE 12.20 Variation of N with L/D (Based on Coyle and Castello, 1981) 38° 40° 200 200 500 57.06 64.62 73.04 82.40 92.80 104.33 117.11 131.24 146.87 164.12 183.16 204.14 227.26 252.71 280.71 311.50 345.34 382.53 423.39 468.28 517.58
A 20 m long concrete pile with a rectangular cross section of 460 mm × 460 mm fully embedded in sand is shown in
Figure P 12.2. Estimate the ultimate point load or tip resistance Qp by each of the following 4 methods and discuss.
Necessary variables and formulae:
Area of the pile tip
Effective vertical stress at the level of the pile tip
Atmospheric pressure 100 kN/m²
Ap
q'
Pa
o'o
Irr
Ir
A
Ms
Mean effective normal ground stress at the level of the pile point
Reduced rigidity index for the soil
Rigidity index for the soil
Average volumetric strain in the plastic zone below the pile point
Poisson's ratio of soil
1) Terzaghi's method (Use Ng
=
2) Meyerhof's method (Use Table 12.6 for interpolation of Na)
Sand: Qp = min (q', 0.5påtanp') · No Ap
3) Vesic's method (Use Table 12.8 for interpolation of N and modulus of elasticity of soil of Es = 600pa)
Sand: Qp = ¯'。No Ap
where ' =
0
exp[(37-4¹) tand
2
1-sin o'
1+2Ko
3
q', K. = 1 - sino', Irr
=
20 m
Ir
1+1,Δ
FIGURE P 12.2
9
Ir
=
For 25° ≤ ø' ≤ 45°, µs = 0.1 +0.3 (25¹), A = 0.005 (1 – $¹_25")
'-25°
q'
{
20°
20° Pa
Es
2(1+μ₂)q'tand'
4) Coyle and Castello's method (Use Figure 12.20 for extrapolation of Na)
Sand: Qp = q'N Ap
Concrete pile
460 mm X 460 mm
Loose sand
φί = 30°
y = 18.6 kN/m³
Dense sand
$'2 = 42°
y = 18.5 kN/m³
expand button
Transcribed Image Text:A 20 m long concrete pile with a rectangular cross section of 460 mm × 460 mm fully embedded in sand is shown in Figure P 12.2. Estimate the ultimate point load or tip resistance Qp by each of the following 4 methods and discuss. Necessary variables and formulae: Area of the pile tip Effective vertical stress at the level of the pile tip Atmospheric pressure 100 kN/m² Ap q' Pa o'o Irr Ir A Ms Mean effective normal ground stress at the level of the pile point Reduced rigidity index for the soil Rigidity index for the soil Average volumetric strain in the plastic zone below the pile point Poisson's ratio of soil 1) Terzaghi's method (Use Ng = 2) Meyerhof's method (Use Table 12.6 for interpolation of Na) Sand: Qp = min (q', 0.5påtanp') · No Ap 3) Vesic's method (Use Table 12.8 for interpolation of N and modulus of elasticity of soil of Es = 600pa) Sand: Qp = ¯'。No Ap where ' = 0 exp[(37-4¹) tand 2 1-sin o' 1+2Ko 3 q', K. = 1 - sino', Irr = 20 m Ir 1+1,Δ FIGURE P 12.2 9 Ir = For 25° ≤ ø' ≤ 45°, µs = 0.1 +0.3 (25¹), A = 0.005 (1 – $¹_25") '-25° q' { 20° 20° Pa Es 2(1+μ₂)q'tand' 4) Coyle and Castello's method (Use Figure 12.20 for extrapolation of Na) Sand: Qp = q'N Ap Concrete pile 460 mm X 460 mm Loose sand φί = 30° y = 18.6 kN/m³ Dense sand $'2 = 42° y = 18.5 kN/m³
Solution
Bartleby Expert
by Bartleby Expert
SEE SOLUTION
Follow-up Question

I need detailed explanation to solve the exercise below. There are some formulas and hints, I also added some tables from the book.
Meyerhof's method, Coyle and Castello's method and Vesic's method were already solved.
A 20 m long concrete pile with a rectangular cross section of 460 mm × 460 mm fully embedded in sand is shown in
Figure P 12.2. Estimate the ultimate point load or tip resistance Qp by each of the following 4 methods and discuss.
Necessary variables and formulae:
Area of the pile tip
Effective vertical stress at the level of the pile tip
Atmospheric pressure 100 kN/m²
Ap
q'
Pa
o'o
Irr
Ir
A
Ms
Mean effective normal ground stress at the level of the pile point
Reduced rigidity index for the soil
Rigidity index for the soil
Average volumetric strain in the plastic zone below the pile point
Poisson's ratio of soil
1) Terzaghi's method (Use Ng
=
2) Meyerhof's method (Use Table 12.6 for interpolation of Na)
Sand: Qp = min (q', 0.5påtanp') · No Ap
3) Vesic's method (Use Table 12.8 for interpolation of N and modulus of elasticity of soil of Es = 600pa)
Sand: Qp = ¯'。No Ap
where ' =
0
exp[(37-4¹) tand
2
1-sin o'
1+2Ko
3
q', K. = 1 - sino', Irr
=
20 m
Ir
1+1,Δ
FIGURE P 12.2
9
Ir
=
For 25° ≤ ø' ≤ 45°, µs = 0.1 +0.3 (25¹), A = 0.005 (1 – $¹_25")
'-25°
q'
{
20°
20° Pa
Es
2(1+μ₂)q'tand'
4) Coyle and Castello's method (Use Figure 12.20 for extrapolation of Na)
Sand: Qp = q'N Ap
Concrete pile
460 mm X 460 mm
Loose sand
φί = 30°
y = 18.6 kN/m³
Dense sand
$'2 = 42°
y = 18.5 kN/m³
expand button
Transcribed Image Text:A 20 m long concrete pile with a rectangular cross section of 460 mm × 460 mm fully embedded in sand is shown in Figure P 12.2. Estimate the ultimate point load or tip resistance Qp by each of the following 4 methods and discuss. Necessary variables and formulae: Area of the pile tip Effective vertical stress at the level of the pile tip Atmospheric pressure 100 kN/m² Ap q' Pa o'o Irr Ir A Ms Mean effective normal ground stress at the level of the pile point Reduced rigidity index for the soil Rigidity index for the soil Average volumetric strain in the plastic zone below the pile point Poisson's ratio of soil 1) Terzaghi's method (Use Ng = 2) Meyerhof's method (Use Table 12.6 for interpolation of Na) Sand: Qp = min (q', 0.5påtanp') · No Ap 3) Vesic's method (Use Table 12.8 for interpolation of N and modulus of elasticity of soil of Es = 600pa) Sand: Qp = ¯'。No Ap where ' = 0 exp[(37-4¹) tand 2 1-sin o' 1+2Ko 3 q', K. = 1 - sino', Irr = 20 m Ir 1+1,Δ FIGURE P 12.2 9 Ir = For 25° ≤ ø' ≤ 45°, µs = 0.1 +0.3 (25¹), A = 0.005 (1 – $¹_25") '-25° q' { 20° 20° Pa Es 2(1+μ₂)q'tand' 4) Coyle and Castello's method (Use Figure 12.20 for extrapolation of Na) Sand: Qp = q'N Ap Concrete pile 460 mm X 460 mm Loose sand φί = 30° y = 18.6 kN/m³ Dense sand $'2 = 42° y = 18.5 kN/m³
TABLE 12.6 Interpolated Values of Ng Based on
Meyerhof's Theory
25
26
27
28
29
Soil friction angle, ø' (deg)
20
21
22
23
24
25
26
27
28
29
30
31
32
33
34
35
36
37
38
10
39
40
41
42
43
20
44
45
TABLE 12.8 Bearing Capacity Factors N. Based on the Theory of Expansion of Cavities
15.95
17.47
19.12
20.91
22.85
24.95
27.22
29.68
32.34
35.21
38.32
41.68
45.31
49.24
53.50
58.10
63.07
68.46
74.30
80.62
87.48
N₂
12.4
13.8
15.5
17.9
21.4
26.0
29.5
34.0
39.7
46.5
56.7
68.2
81.0
96.0
40
115.0
143.0
168.0
194.0
231.0
60
276.0
346.0
420.0
525.0
650.0
780.0
930.0
Embedment ratio, L/D
0
ITT
10
20
30
40
50
60
70
10
T
T
T
Bearing capacity factor, N*
9
20
40 60 80 100
$' = 30°
80
300
400
12.12
20.98
24.64
27.61
39.70
46.61
52.24
13.18
23.15
27.30
30.69
44.53
52.51
59.02
14.33
25.52
30.21
34.06
49.88
59.05
66.56
15.57
28.10
33.40
37.75
55.77
66.29
74.93
16.90
30.90
36.87
41.79
62.27
74.30
84.21
30
18.24
33.95
40.66
46.21
69.43
83.14
94.48
31
19.88
37.27
44.79
51.03
77.31
92.90
105.84
32
21.55
40.88
49.30
56.30
85.96
103.66
118.39
33
23.34
44.80
54.20
62.05
95.46
115.51
132.24
34
25.28
49.05
59.54
68.33
105.90
128.55
147.51
35
27.36
53.67
65.36
75.17
117.33
142.89
164.33
36
29.60
58.68
71.69
82.62
129.87
158.65
182.85
37
32.02
64.13
78.57
90.75
143.61
175.95
203.23
38
34.63
70.03
86.05
99.60
158.65
194.94
225.62
39
37.44
76.45
94.20
109.24
175.11
215.78
250.23
40
40.47
83.40
103.05
119.74
193.13
238.62
277.26
41
43.74
90.96
112.68
131.18
212.84
263.67
306.94
42
47.27
99.16
123.16
143.64
234.40
291.13
339.52
43
51.08
108.08
134.56
157.21
257.99
321.22
375.28
44
55.20
117.76
146.97
172.00
283.80
354.20
414.51
45
59.66
128.28
160.48
188.12
312.03
390.35
457.57
Based on data from "Design of Pile Foundations," by A. S. Vesic. Synthesis of Highway Practice by American Association of State Highway and Transportation, 1977
32° 36°
100
30.16
33.60
37.37
41.51
46.05
51.02
56.46
62.41
68.92
76.02
83.78
92.24
101.48
111.56
122.54
134.52
147.59
161.83
177.36
194.31
212.79
34°
FIGURE 12.20 Variation of N with L/D
(Based on Coyle and Castello, 1981)
38°
40°
200
200
500
57.06
64.62
73.04
82.40
92.80
104.33
117.11
131.24
146.87
164.12
183.16
204.14
227.26
252.71
280.71
311.50
345.34
382.53
423.39
468.28
517.58
expand button
Transcribed Image Text:TABLE 12.6 Interpolated Values of Ng Based on Meyerhof's Theory 25 26 27 28 29 Soil friction angle, ø' (deg) 20 21 22 23 24 25 26 27 28 29 30 31 32 33 34 35 36 37 38 10 39 40 41 42 43 20 44 45 TABLE 12.8 Bearing Capacity Factors N. Based on the Theory of Expansion of Cavities 15.95 17.47 19.12 20.91 22.85 24.95 27.22 29.68 32.34 35.21 38.32 41.68 45.31 49.24 53.50 58.10 63.07 68.46 74.30 80.62 87.48 N₂ 12.4 13.8 15.5 17.9 21.4 26.0 29.5 34.0 39.7 46.5 56.7 68.2 81.0 96.0 40 115.0 143.0 168.0 194.0 231.0 60 276.0 346.0 420.0 525.0 650.0 780.0 930.0 Embedment ratio, L/D 0 ITT 10 20 30 40 50 60 70 10 T T T Bearing capacity factor, N* 9 20 40 60 80 100 $' = 30° 80 300 400 12.12 20.98 24.64 27.61 39.70 46.61 52.24 13.18 23.15 27.30 30.69 44.53 52.51 59.02 14.33 25.52 30.21 34.06 49.88 59.05 66.56 15.57 28.10 33.40 37.75 55.77 66.29 74.93 16.90 30.90 36.87 41.79 62.27 74.30 84.21 30 18.24 33.95 40.66 46.21 69.43 83.14 94.48 31 19.88 37.27 44.79 51.03 77.31 92.90 105.84 32 21.55 40.88 49.30 56.30 85.96 103.66 118.39 33 23.34 44.80 54.20 62.05 95.46 115.51 132.24 34 25.28 49.05 59.54 68.33 105.90 128.55 147.51 35 27.36 53.67 65.36 75.17 117.33 142.89 164.33 36 29.60 58.68 71.69 82.62 129.87 158.65 182.85 37 32.02 64.13 78.57 90.75 143.61 175.95 203.23 38 34.63 70.03 86.05 99.60 158.65 194.94 225.62 39 37.44 76.45 94.20 109.24 175.11 215.78 250.23 40 40.47 83.40 103.05 119.74 193.13 238.62 277.26 41 43.74 90.96 112.68 131.18 212.84 263.67 306.94 42 47.27 99.16 123.16 143.64 234.40 291.13 339.52 43 51.08 108.08 134.56 157.21 257.99 321.22 375.28 44 55.20 117.76 146.97 172.00 283.80 354.20 414.51 45 59.66 128.28 160.48 188.12 312.03 390.35 457.57 Based on data from "Design of Pile Foundations," by A. S. Vesic. Synthesis of Highway Practice by American Association of State Highway and Transportation, 1977 32° 36° 100 30.16 33.60 37.37 41.51 46.05 51.02 56.46 62.41 68.92 76.02 83.78 92.24 101.48 111.56 122.54 134.52 147.59 161.83 177.36 194.31 212.79 34° FIGURE 12.20 Variation of N with L/D (Based on Coyle and Castello, 1981) 38° 40° 200 200 500 57.06 64.62 73.04 82.40 92.80 104.33 117.11 131.24 146.87 164.12 183.16 204.14 227.26 252.71 280.71 311.50 345.34 382.53 423.39 468.28 517.58
Solution
Bartleby Expert
by Bartleby Expert
SEE SOLUTION
Follow-up Question

I need detailed explanation to solve the exercise below. There are some formulas and hints, I also added some tables from the book.
Meyerhof's method, Coyle and Castello's method and Vesic's method were already solved.
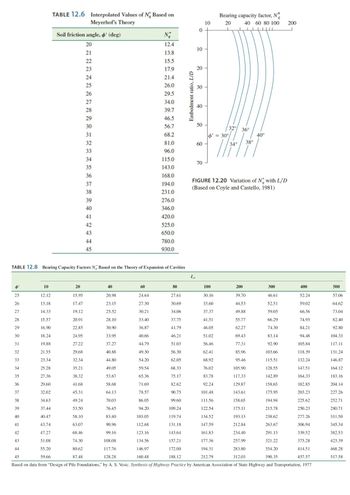
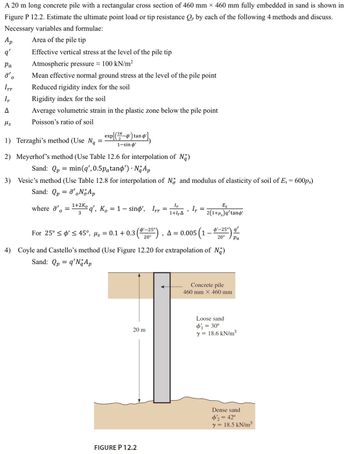
TABLE 12.6 Interpolated Values of Ng Based on
Meyerhof's Theory
25
26
27
28
29
Soil friction angle, ø' (deg)
20
21
22
23
24
25
26
27
28
29
30
31
32
33
34
35
36
37
38
10
39
40
41
42
43
20
44
45
TABLE 12.8 Bearing Capacity Factors N. Based on the Theory of Expansion of Cavities
15.95
17.47
19.12
20.91
22.85
24.95
27.22
29.68
32.34
35.21
38.32
41.68
45.31
49.24
53.50
58.10
63.07
68.46
74.30
80.62
87.48
N₂
12.4
13.8
15.5
17.9
21.4
26.0
29.5
34.0
39.7
46.5
56.7
68.2
81.0
96.0
40
115.0
143.0
168.0
194.0
231.0
60
276.0
346.0
420.0
525.0
650.0
780.0
930.0
Embedment ratio, L/D
0
ITT
10
20
30
40
50
60
70
10
T
T
T
Bearing capacity factor, N*
9
20
40 60 80 100
$' = 30°
80
300
400
12.12
20.98
24.64
27.61
39.70
46.61
52.24
13.18
23.15
27.30
30.69
44.53
52.51
59.02
14.33
25.52
30.21
34.06
49.88
59.05
66.56
15.57
28.10
33.40
37.75
55.77
66.29
74.93
16.90
30.90
36.87
41.79
62.27
74.30
84.21
30
18.24
33.95
40.66
46.21
69.43
83.14
94.48
31
19.88
37.27
44.79
51.03
77.31
92.90
105.84
32
21.55
40.88
49.30
56.30
85.96
103.66
118.39
33
23.34
44.80
54.20
62.05
95.46
115.51
132.24
34
25.28
49.05
59.54
68.33
105.90
128.55
147.51
35
27.36
53.67
65.36
75.17
117.33
142.89
164.33
36
29.60
58.68
71.69
82.62
129.87
158.65
182.85
37
32.02
64.13
78.57
90.75
143.61
175.95
203.23
38
34.63
70.03
86.05
99.60
158.65
194.94
225.62
39
37.44
76.45
94.20
109.24
175.11
215.78
250.23
40
40.47
83.40
103.05
119.74
193.13
238.62
277.26
41
43.74
90.96
112.68
131.18
212.84
263.67
306.94
42
47.27
99.16
123.16
143.64
234.40
291.13
339.52
43
51.08
108.08
134.56
157.21
257.99
321.22
375.28
44
55.20
117.76
146.97
172.00
283.80
354.20
414.51
45
59.66
128.28
160.48
188.12
312.03
390.35
457.57
Based on data from "Design of Pile Foundations," by A. S. Vesic. Synthesis of Highway Practice by American Association of State Highway and Transportation, 1977
32° 36°
100
30.16
33.60
37.37
41.51
46.05
51.02
56.46
62.41
68.92
76.02
83.78
92.24
101.48
111.56
122.54
134.52
147.59
161.83
177.36
194.31
212.79
34°
FIGURE 12.20 Variation of N with L/D
(Based on Coyle and Castello, 1981)
38°
40°
200
200
500
57.06
64.62
73.04
82.40
92.80
104.33
117.11
131.24
146.87
164.12
183.16
204.14
227.26
252.71
280.71
311.50
345.34
382.53
423.39
468.28
517.58
expand button
Transcribed Image Text:TABLE 12.6 Interpolated Values of Ng Based on Meyerhof's Theory 25 26 27 28 29 Soil friction angle, ø' (deg) 20 21 22 23 24 25 26 27 28 29 30 31 32 33 34 35 36 37 38 10 39 40 41 42 43 20 44 45 TABLE 12.8 Bearing Capacity Factors N. Based on the Theory of Expansion of Cavities 15.95 17.47 19.12 20.91 22.85 24.95 27.22 29.68 32.34 35.21 38.32 41.68 45.31 49.24 53.50 58.10 63.07 68.46 74.30 80.62 87.48 N₂ 12.4 13.8 15.5 17.9 21.4 26.0 29.5 34.0 39.7 46.5 56.7 68.2 81.0 96.0 40 115.0 143.0 168.0 194.0 231.0 60 276.0 346.0 420.0 525.0 650.0 780.0 930.0 Embedment ratio, L/D 0 ITT 10 20 30 40 50 60 70 10 T T T Bearing capacity factor, N* 9 20 40 60 80 100 $' = 30° 80 300 400 12.12 20.98 24.64 27.61 39.70 46.61 52.24 13.18 23.15 27.30 30.69 44.53 52.51 59.02 14.33 25.52 30.21 34.06 49.88 59.05 66.56 15.57 28.10 33.40 37.75 55.77 66.29 74.93 16.90 30.90 36.87 41.79 62.27 74.30 84.21 30 18.24 33.95 40.66 46.21 69.43 83.14 94.48 31 19.88 37.27 44.79 51.03 77.31 92.90 105.84 32 21.55 40.88 49.30 56.30 85.96 103.66 118.39 33 23.34 44.80 54.20 62.05 95.46 115.51 132.24 34 25.28 49.05 59.54 68.33 105.90 128.55 147.51 35 27.36 53.67 65.36 75.17 117.33 142.89 164.33 36 29.60 58.68 71.69 82.62 129.87 158.65 182.85 37 32.02 64.13 78.57 90.75 143.61 175.95 203.23 38 34.63 70.03 86.05 99.60 158.65 194.94 225.62 39 37.44 76.45 94.20 109.24 175.11 215.78 250.23 40 40.47 83.40 103.05 119.74 193.13 238.62 277.26 41 43.74 90.96 112.68 131.18 212.84 263.67 306.94 42 47.27 99.16 123.16 143.64 234.40 291.13 339.52 43 51.08 108.08 134.56 157.21 257.99 321.22 375.28 44 55.20 117.76 146.97 172.00 283.80 354.20 414.51 45 59.66 128.28 160.48 188.12 312.03 390.35 457.57 Based on data from "Design of Pile Foundations," by A. S. Vesic. Synthesis of Highway Practice by American Association of State Highway and Transportation, 1977 32° 36° 100 30.16 33.60 37.37 41.51 46.05 51.02 56.46 62.41 68.92 76.02 83.78 92.24 101.48 111.56 122.54 134.52 147.59 161.83 177.36 194.31 212.79 34° FIGURE 12.20 Variation of N with L/D (Based on Coyle and Castello, 1981) 38° 40° 200 200 500 57.06 64.62 73.04 82.40 92.80 104.33 117.11 131.24 146.87 164.12 183.16 204.14 227.26 252.71 280.71 311.50 345.34 382.53 423.39 468.28 517.58
A 20 m long concrete pile with a rectangular cross section of 460 mm × 460 mm fully embedded in sand is shown in
Figure P 12.2. Estimate the ultimate point load or tip resistance Qp by each of the following 4 methods and discuss.
Necessary variables and formulae:
Area of the pile tip
Effective vertical stress at the level of the pile tip
Atmospheric pressure 100 kN/m²
Ap
q'
Pa
o'o
Irr
Ir
A
Ms
Mean effective normal ground stress at the level of the pile point
Reduced rigidity index for the soil
Rigidity index for the soil
Average volumetric strain in the plastic zone below the pile point
Poisson's ratio of soil
1) Terzaghi's method (Use Ng
=
2) Meyerhof's method (Use Table 12.6 for interpolation of Na)
Sand: Qp = min (q', 0.5påtanp') · No Ap
3) Vesic's method (Use Table 12.8 for interpolation of N and modulus of elasticity of soil of Es = 600pa)
Sand: Qp = ¯'。No Ap
where ' =
0
exp[(37-4¹) tand
2
1-sin o'
1+2Ko
3
q', K. = 1 - sino', Irr
=
20 m
Ir
1+1,Δ
FIGURE P 12.2
9
Ir
=
For 25° ≤ ø' ≤ 45°, µs = 0.1 +0.3 (25¹), A = 0.005 (1 – $¹_25")
'-25°
q'
{
20°
20° Pa
Es
2(1+μ₂)q'tand'
4) Coyle and Castello's method (Use Figure 12.20 for extrapolation of Na)
Sand: Qp = q'N Ap
Concrete pile
460 mm X 460 mm
Loose sand
φί = 30°
y = 18.6 kN/m³
Dense sand
$'2 = 42°
y = 18.5 kN/m³
expand button
Transcribed Image Text:A 20 m long concrete pile with a rectangular cross section of 460 mm × 460 mm fully embedded in sand is shown in Figure P 12.2. Estimate the ultimate point load or tip resistance Qp by each of the following 4 methods and discuss. Necessary variables and formulae: Area of the pile tip Effective vertical stress at the level of the pile tip Atmospheric pressure 100 kN/m² Ap q' Pa o'o Irr Ir A Ms Mean effective normal ground stress at the level of the pile point Reduced rigidity index for the soil Rigidity index for the soil Average volumetric strain in the plastic zone below the pile point Poisson's ratio of soil 1) Terzaghi's method (Use Ng = 2) Meyerhof's method (Use Table 12.6 for interpolation of Na) Sand: Qp = min (q', 0.5påtanp') · No Ap 3) Vesic's method (Use Table 12.8 for interpolation of N and modulus of elasticity of soil of Es = 600pa) Sand: Qp = ¯'。No Ap where ' = 0 exp[(37-4¹) tand 2 1-sin o' 1+2Ko 3 q', K. = 1 - sino', Irr = 20 m Ir 1+1,Δ FIGURE P 12.2 9 Ir = For 25° ≤ ø' ≤ 45°, µs = 0.1 +0.3 (25¹), A = 0.005 (1 – $¹_25") '-25° q' { 20° 20° Pa Es 2(1+μ₂)q'tand' 4) Coyle and Castello's method (Use Figure 12.20 for extrapolation of Na) Sand: Qp = q'N Ap Concrete pile 460 mm X 460 mm Loose sand φί = 30° y = 18.6 kN/m³ Dense sand $'2 = 42° y = 18.5 kN/m³
Solution
Bartleby Expert
by Bartleby Expert
SEE SOLUTION
Follow-up Question

I need detailed explanation to solve the exercise below. There are some formulas and hints, I also added some tables from the book.
Meyerhof's method, Coyle and Castello's method and Vesic's method were already solved.
A 20 m long concrete pile with a rectangular cross section of 460 mm × 460 mm fully embedded in sand is shown in
Figure P 12.2. Estimate the ultimate point load or tip resistance Qp by each of the following 4 methods and discuss.
Necessary variables and formulae:
Area of the pile tip
Effective vertical stress at the level of the pile tip
Atmospheric pressure 100 kN/m²
Ap
q'
Pa
o'o
Irr
Ir
A
Ms
Mean effective normal ground stress at the level of the pile point
Reduced rigidity index for the soil
Rigidity index for the soil
Average volumetric strain in the plastic zone below the pile point
Poisson's ratio of soil
1) Terzaghi's method (Use Ng
=
2) Meyerhof's method (Use Table 12.6 for interpolation of Na)
Sand: Qp = min (q', 0.5påtanp') · No Ap
3) Vesic's method (Use Table 12.8 for interpolation of N and modulus of elasticity of soil of Es = 600pa)
Sand: Qp = ¯'。No Ap
where ' =
0
exp[(37-4¹) tand
2
1-sin o'
1+2Ko
3
q', K. = 1 - sino', Irr
=
20 m
Ir
1+1,Δ
FIGURE P 12.2
9
Ir
=
For 25° ≤ ø' ≤ 45°, µs = 0.1 +0.3 (25¹), A = 0.005 (1 – $¹_25")
'-25°
q'
{
20°
20° Pa
Es
2(1+μ₂)q'tand'
4) Coyle and Castello's method (Use Figure 12.20 for extrapolation of Na)
Sand: Qp = q'N Ap
Concrete pile
460 mm X 460 mm
Loose sand
φί = 30°
y = 18.6 kN/m³
Dense sand
$'2 = 42°
y = 18.5 kN/m³
expand button
Transcribed Image Text:A 20 m long concrete pile with a rectangular cross section of 460 mm × 460 mm fully embedded in sand is shown in Figure P 12.2. Estimate the ultimate point load or tip resistance Qp by each of the following 4 methods and discuss. Necessary variables and formulae: Area of the pile tip Effective vertical stress at the level of the pile tip Atmospheric pressure 100 kN/m² Ap q' Pa o'o Irr Ir A Ms Mean effective normal ground stress at the level of the pile point Reduced rigidity index for the soil Rigidity index for the soil Average volumetric strain in the plastic zone below the pile point Poisson's ratio of soil 1) Terzaghi's method (Use Ng = 2) Meyerhof's method (Use Table 12.6 for interpolation of Na) Sand: Qp = min (q', 0.5påtanp') · No Ap 3) Vesic's method (Use Table 12.8 for interpolation of N and modulus of elasticity of soil of Es = 600pa) Sand: Qp = ¯'。No Ap where ' = 0 exp[(37-4¹) tand 2 1-sin o' 1+2Ko 3 q', K. = 1 - sino', Irr = 20 m Ir 1+1,Δ FIGURE P 12.2 9 Ir = For 25° ≤ ø' ≤ 45°, µs = 0.1 +0.3 (25¹), A = 0.005 (1 – $¹_25") '-25° q' { 20° 20° Pa Es 2(1+μ₂)q'tand' 4) Coyle and Castello's method (Use Figure 12.20 for extrapolation of Na) Sand: Qp = q'N Ap Concrete pile 460 mm X 460 mm Loose sand φί = 30° y = 18.6 kN/m³ Dense sand $'2 = 42° y = 18.5 kN/m³
TABLE 12.6 Interpolated Values of Ng Based on
Meyerhof's Theory
25
26
27
28
29
Soil friction angle, ø' (deg)
20
21
22
23
24
25
26
27
28
29
30
31
32
33
34
35
36
37
38
10
39
40
41
42
43
20
44
45
TABLE 12.8 Bearing Capacity Factors N. Based on the Theory of Expansion of Cavities
15.95
17.47
19.12
20.91
22.85
24.95
27.22
29.68
32.34
35.21
38.32
41.68
45.31
49.24
53.50
58.10
63.07
68.46
74.30
80.62
87.48
N₂
12.4
13.8
15.5
17.9
21.4
26.0
29.5
34.0
39.7
46.5
56.7
68.2
81.0
96.0
40
115.0
143.0
168.0
194.0
231.0
60
276.0
346.0
420.0
525.0
650.0
780.0
930.0
Embedment ratio, L/D
0
ITT
10
20
30
40
50
60
70
10
T
T
T
Bearing capacity factor, N*
9
20
40 60 80 100
$' = 30°
80
300
400
12.12
20.98
24.64
27.61
39.70
46.61
52.24
13.18
23.15
27.30
30.69
44.53
52.51
59.02
14.33
25.52
30.21
34.06
49.88
59.05
66.56
15.57
28.10
33.40
37.75
55.77
66.29
74.93
16.90
30.90
36.87
41.79
62.27
74.30
84.21
30
18.24
33.95
40.66
46.21
69.43
83.14
94.48
31
19.88
37.27
44.79
51.03
77.31
92.90
105.84
32
21.55
40.88
49.30
56.30
85.96
103.66
118.39
33
23.34
44.80
54.20
62.05
95.46
115.51
132.24
34
25.28
49.05
59.54
68.33
105.90
128.55
147.51
35
27.36
53.67
65.36
75.17
117.33
142.89
164.33
36
29.60
58.68
71.69
82.62
129.87
158.65
182.85
37
32.02
64.13
78.57
90.75
143.61
175.95
203.23
38
34.63
70.03
86.05
99.60
158.65
194.94
225.62
39
37.44
76.45
94.20
109.24
175.11
215.78
250.23
40
40.47
83.40
103.05
119.74
193.13
238.62
277.26
41
43.74
90.96
112.68
131.18
212.84
263.67
306.94
42
47.27
99.16
123.16
143.64
234.40
291.13
339.52
43
51.08
108.08
134.56
157.21
257.99
321.22
375.28
44
55.20
117.76
146.97
172.00
283.80
354.20
414.51
45
59.66
128.28
160.48
188.12
312.03
390.35
457.57
Based on data from "Design of Pile Foundations," by A. S. Vesic. Synthesis of Highway Practice by American Association of State Highway and Transportation, 1977
32° 36°
100
30.16
33.60
37.37
41.51
46.05
51.02
56.46
62.41
68.92
76.02
83.78
92.24
101.48
111.56
122.54
134.52
147.59
161.83
177.36
194.31
212.79
34°
FIGURE 12.20 Variation of N with L/D
(Based on Coyle and Castello, 1981)
38°
40°
200
200
500
57.06
64.62
73.04
82.40
92.80
104.33
117.11
131.24
146.87
164.12
183.16
204.14
227.26
252.71
280.71
311.50
345.34
382.53
423.39
468.28
517.58
expand button
Transcribed Image Text:TABLE 12.6 Interpolated Values of Ng Based on Meyerhof's Theory 25 26 27 28 29 Soil friction angle, ø' (deg) 20 21 22 23 24 25 26 27 28 29 30 31 32 33 34 35 36 37 38 10 39 40 41 42 43 20 44 45 TABLE 12.8 Bearing Capacity Factors N. Based on the Theory of Expansion of Cavities 15.95 17.47 19.12 20.91 22.85 24.95 27.22 29.68 32.34 35.21 38.32 41.68 45.31 49.24 53.50 58.10 63.07 68.46 74.30 80.62 87.48 N₂ 12.4 13.8 15.5 17.9 21.4 26.0 29.5 34.0 39.7 46.5 56.7 68.2 81.0 96.0 40 115.0 143.0 168.0 194.0 231.0 60 276.0 346.0 420.0 525.0 650.0 780.0 930.0 Embedment ratio, L/D 0 ITT 10 20 30 40 50 60 70 10 T T T Bearing capacity factor, N* 9 20 40 60 80 100 $' = 30° 80 300 400 12.12 20.98 24.64 27.61 39.70 46.61 52.24 13.18 23.15 27.30 30.69 44.53 52.51 59.02 14.33 25.52 30.21 34.06 49.88 59.05 66.56 15.57 28.10 33.40 37.75 55.77 66.29 74.93 16.90 30.90 36.87 41.79 62.27 74.30 84.21 30 18.24 33.95 40.66 46.21 69.43 83.14 94.48 31 19.88 37.27 44.79 51.03 77.31 92.90 105.84 32 21.55 40.88 49.30 56.30 85.96 103.66 118.39 33 23.34 44.80 54.20 62.05 95.46 115.51 132.24 34 25.28 49.05 59.54 68.33 105.90 128.55 147.51 35 27.36 53.67 65.36 75.17 117.33 142.89 164.33 36 29.60 58.68 71.69 82.62 129.87 158.65 182.85 37 32.02 64.13 78.57 90.75 143.61 175.95 203.23 38 34.63 70.03 86.05 99.60 158.65 194.94 225.62 39 37.44 76.45 94.20 109.24 175.11 215.78 250.23 40 40.47 83.40 103.05 119.74 193.13 238.62 277.26 41 43.74 90.96 112.68 131.18 212.84 263.67 306.94 42 47.27 99.16 123.16 143.64 234.40 291.13 339.52 43 51.08 108.08 134.56 157.21 257.99 321.22 375.28 44 55.20 117.76 146.97 172.00 283.80 354.20 414.51 45 59.66 128.28 160.48 188.12 312.03 390.35 457.57 Based on data from "Design of Pile Foundations," by A. S. Vesic. Synthesis of Highway Practice by American Association of State Highway and Transportation, 1977 32° 36° 100 30.16 33.60 37.37 41.51 46.05 51.02 56.46 62.41 68.92 76.02 83.78 92.24 101.48 111.56 122.54 134.52 147.59 161.83 177.36 194.31 212.79 34° FIGURE 12.20 Variation of N with L/D (Based on Coyle and Castello, 1981) 38° 40° 200 200 500 57.06 64.62 73.04 82.40 92.80 104.33 117.11 131.24 146.87 164.12 183.16 204.14 227.26 252.71 280.71 311.50 345.34 382.53 423.39 468.28 517.58
Solution
Bartleby Expert
by Bartleby Expert
SEE SOLUTION
Follow-up Question

I need detailed explanation to solve the exercise below. There are some formulas and hints, I also added some tables from the book.
Meyerhof's method, Coyle and Castello's method and Vesic's method were already solved.
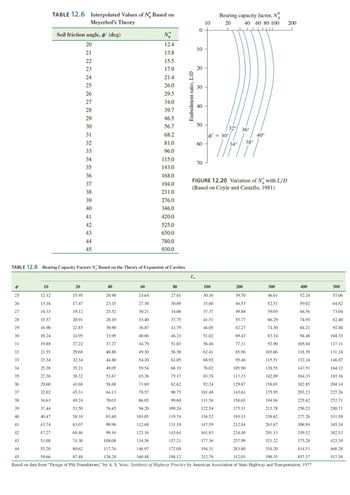
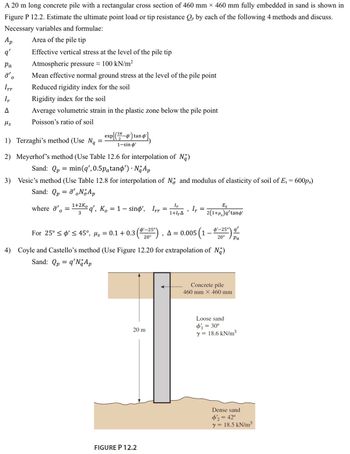
TABLE 12.6 Interpolated Values of Ng Based on
Meyerhof's Theory
25
26
27
28
29
Soil friction angle, ø' (deg)
20
21
22
23
24
25
26
27
28
29
30
31
32
33
34
35
36
37
38
10
39
40
41
42
43
20
44
45
TABLE 12.8 Bearing Capacity Factors N. Based on the Theory of Expansion of Cavities
15.95
17.47
19.12
20.91
22.85
24.95
27.22
29.68
32.34
35.21
38.32
41.68
45.31
49.24
53.50
58.10
63.07
68.46
74.30
80.62
87.48
N₂
12.4
13.8
15.5
17.9
21.4
26.0
29.5
34.0
39.7
46.5
56.7
68.2
81.0
96.0
40
115.0
143.0
168.0
194.0
231.0
60
276.0
346.0
420.0
525.0
650.0
780.0
930.0
Embedment ratio, L/D
0
ITT
10
20
30
40
50
60
70
10
T
T
T
Bearing capacity factor, N*
9
20
40 60 80 100
$' = 30°
80
300
400
12.12
20.98
24.64
27.61
39.70
46.61
52.24
13.18
23.15
27.30
30.69
44.53
52.51
59.02
14.33
25.52
30.21
34.06
49.88
59.05
66.56
15.57
28.10
33.40
37.75
55.77
66.29
74.93
16.90
30.90
36.87
41.79
62.27
74.30
84.21
30
18.24
33.95
40.66
46.21
69.43
83.14
94.48
31
19.88
37.27
44.79
51.03
77.31
92.90
105.84
32
21.55
40.88
49.30
56.30
85.96
103.66
118.39
33
23.34
44.80
54.20
62.05
95.46
115.51
132.24
34
25.28
49.05
59.54
68.33
105.90
128.55
147.51
35
27.36
53.67
65.36
75.17
117.33
142.89
164.33
36
29.60
58.68
71.69
82.62
129.87
158.65
182.85
37
32.02
64.13
78.57
90.75
143.61
175.95
203.23
38
34.63
70.03
86.05
99.60
158.65
194.94
225.62
39
37.44
76.45
94.20
109.24
175.11
215.78
250.23
40
40.47
83.40
103.05
119.74
193.13
238.62
277.26
41
43.74
90.96
112.68
131.18
212.84
263.67
306.94
42
47.27
99.16
123.16
143.64
234.40
291.13
339.52
43
51.08
108.08
134.56
157.21
257.99
321.22
375.28
44
55.20
117.76
146.97
172.00
283.80
354.20
414.51
45
59.66
128.28
160.48
188.12
312.03
390.35
457.57
Based on data from "Design of Pile Foundations," by A. S. Vesic. Synthesis of Highway Practice by American Association of State Highway and Transportation, 1977
32° 36°
100
30.16
33.60
37.37
41.51
46.05
51.02
56.46
62.41
68.92
76.02
83.78
92.24
101.48
111.56
122.54
134.52
147.59
161.83
177.36
194.31
212.79
34°
FIGURE 12.20 Variation of N with L/D
(Based on Coyle and Castello, 1981)
38°
40°
200
200
500
57.06
64.62
73.04
82.40
92.80
104.33
117.11
131.24
146.87
164.12
183.16
204.14
227.26
252.71
280.71
311.50
345.34
382.53
423.39
468.28
517.58
expand button
Transcribed Image Text:TABLE 12.6 Interpolated Values of Ng Based on Meyerhof's Theory 25 26 27 28 29 Soil friction angle, ø' (deg) 20 21 22 23 24 25 26 27 28 29 30 31 32 33 34 35 36 37 38 10 39 40 41 42 43 20 44 45 TABLE 12.8 Bearing Capacity Factors N. Based on the Theory of Expansion of Cavities 15.95 17.47 19.12 20.91 22.85 24.95 27.22 29.68 32.34 35.21 38.32 41.68 45.31 49.24 53.50 58.10 63.07 68.46 74.30 80.62 87.48 N₂ 12.4 13.8 15.5 17.9 21.4 26.0 29.5 34.0 39.7 46.5 56.7 68.2 81.0 96.0 40 115.0 143.0 168.0 194.0 231.0 60 276.0 346.0 420.0 525.0 650.0 780.0 930.0 Embedment ratio, L/D 0 ITT 10 20 30 40 50 60 70 10 T T T Bearing capacity factor, N* 9 20 40 60 80 100 $' = 30° 80 300 400 12.12 20.98 24.64 27.61 39.70 46.61 52.24 13.18 23.15 27.30 30.69 44.53 52.51 59.02 14.33 25.52 30.21 34.06 49.88 59.05 66.56 15.57 28.10 33.40 37.75 55.77 66.29 74.93 16.90 30.90 36.87 41.79 62.27 74.30 84.21 30 18.24 33.95 40.66 46.21 69.43 83.14 94.48 31 19.88 37.27 44.79 51.03 77.31 92.90 105.84 32 21.55 40.88 49.30 56.30 85.96 103.66 118.39 33 23.34 44.80 54.20 62.05 95.46 115.51 132.24 34 25.28 49.05 59.54 68.33 105.90 128.55 147.51 35 27.36 53.67 65.36 75.17 117.33 142.89 164.33 36 29.60 58.68 71.69 82.62 129.87 158.65 182.85 37 32.02 64.13 78.57 90.75 143.61 175.95 203.23 38 34.63 70.03 86.05 99.60 158.65 194.94 225.62 39 37.44 76.45 94.20 109.24 175.11 215.78 250.23 40 40.47 83.40 103.05 119.74 193.13 238.62 277.26 41 43.74 90.96 112.68 131.18 212.84 263.67 306.94 42 47.27 99.16 123.16 143.64 234.40 291.13 339.52 43 51.08 108.08 134.56 157.21 257.99 321.22 375.28 44 55.20 117.76 146.97 172.00 283.80 354.20 414.51 45 59.66 128.28 160.48 188.12 312.03 390.35 457.57 Based on data from "Design of Pile Foundations," by A. S. Vesic. Synthesis of Highway Practice by American Association of State Highway and Transportation, 1977 32° 36° 100 30.16 33.60 37.37 41.51 46.05 51.02 56.46 62.41 68.92 76.02 83.78 92.24 101.48 111.56 122.54 134.52 147.59 161.83 177.36 194.31 212.79 34° FIGURE 12.20 Variation of N with L/D (Based on Coyle and Castello, 1981) 38° 40° 200 200 500 57.06 64.62 73.04 82.40 92.80 104.33 117.11 131.24 146.87 164.12 183.16 204.14 227.26 252.71 280.71 311.50 345.34 382.53 423.39 468.28 517.58
A 20 m long concrete pile with a rectangular cross section of 460 mm × 460 mm fully embedded in sand is shown in
Figure P 12.2. Estimate the ultimate point load or tip resistance Qp by each of the following 4 methods and discuss.
Necessary variables and formulae:
Area of the pile tip
Effective vertical stress at the level of the pile tip
Atmospheric pressure 100 kN/m²
Ap
q'
Pa
o'o
Irr
Ir
A
Ms
Mean effective normal ground stress at the level of the pile point
Reduced rigidity index for the soil
Rigidity index for the soil
Average volumetric strain in the plastic zone below the pile point
Poisson's ratio of soil
1) Terzaghi's method (Use Ng
=
2) Meyerhof's method (Use Table 12.6 for interpolation of Na)
Sand: Qp = min (q', 0.5påtanp') · No Ap
3) Vesic's method (Use Table 12.8 for interpolation of N and modulus of elasticity of soil of Es = 600pa)
Sand: Qp = ¯'。No Ap
where ' =
0
exp[(37-4¹) tand
2
1-sin o'
1+2Ko
3
q', K. = 1 - sino', Irr
=
20 m
Ir
1+1,Δ
FIGURE P 12.2
9
Ir
=
For 25° ≤ ø' ≤ 45°, µs = 0.1 +0.3 (25¹), A = 0.005 (1 – $¹_25")
'-25°
q'
{
20°
20° Pa
Es
2(1+μ₂)q'tand'
4) Coyle and Castello's method (Use Figure 12.20 for extrapolation of Na)
Sand: Qp = q'N Ap
Concrete pile
460 mm X 460 mm
Loose sand
φί = 30°
y = 18.6 kN/m³
Dense sand
$'2 = 42°
y = 18.5 kN/m³
expand button
Transcribed Image Text:A 20 m long concrete pile with a rectangular cross section of 460 mm × 460 mm fully embedded in sand is shown in Figure P 12.2. Estimate the ultimate point load or tip resistance Qp by each of the following 4 methods and discuss. Necessary variables and formulae: Area of the pile tip Effective vertical stress at the level of the pile tip Atmospheric pressure 100 kN/m² Ap q' Pa o'o Irr Ir A Ms Mean effective normal ground stress at the level of the pile point Reduced rigidity index for the soil Rigidity index for the soil Average volumetric strain in the plastic zone below the pile point Poisson's ratio of soil 1) Terzaghi's method (Use Ng = 2) Meyerhof's method (Use Table 12.6 for interpolation of Na) Sand: Qp = min (q', 0.5påtanp') · No Ap 3) Vesic's method (Use Table 12.8 for interpolation of N and modulus of elasticity of soil of Es = 600pa) Sand: Qp = ¯'。No Ap where ' = 0 exp[(37-4¹) tand 2 1-sin o' 1+2Ko 3 q', K. = 1 - sino', Irr = 20 m Ir 1+1,Δ FIGURE P 12.2 9 Ir = For 25° ≤ ø' ≤ 45°, µs = 0.1 +0.3 (25¹), A = 0.005 (1 – $¹_25") '-25° q' { 20° 20° Pa Es 2(1+μ₂)q'tand' 4) Coyle and Castello's method (Use Figure 12.20 for extrapolation of Na) Sand: Qp = q'N Ap Concrete pile 460 mm X 460 mm Loose sand φί = 30° y = 18.6 kN/m³ Dense sand $'2 = 42° y = 18.5 kN/m³
Solution
Bartleby Expert
by Bartleby Expert
SEE SOLUTION
Follow-up Question

I need detailed explanation to solve the exercise below. There are some formulas and hints, I also added some tables from the book.
Meyerhof's method, Coyle and Castello's method and Vesic's method were already solved.
A 20 m long concrete pile with a rectangular cross section of 460 mm × 460 mm fully embedded in sand is shown in
Figure P 12.2. Estimate the ultimate point load or tip resistance Qp by each of the following 4 methods and discuss.
Necessary variables and formulae:
Area of the pile tip
Effective vertical stress at the level of the pile tip
Atmospheric pressure 100 kN/m²
Ap
q'
Pa
o'o
Irr
Ir
A
Ms
Mean effective normal ground stress at the level of the pile point
Reduced rigidity index for the soil
Rigidity index for the soil
Average volumetric strain in the plastic zone below the pile point
Poisson's ratio of soil
1) Terzaghi's method (Use Ng
=
2) Meyerhof's method (Use Table 12.6 for interpolation of Na)
Sand: Qp = min (q', 0.5påtanp') · No Ap
3) Vesic's method (Use Table 12.8 for interpolation of N and modulus of elasticity of soil of Es = 600pa)
Sand: Qp = ¯'。No Ap
where ' =
0
exp[(37-4¹) tand
2
1-sin o'
1+2Ko
3
q', K. = 1 - sino', Irr
=
20 m
Ir
1+1,Δ
FIGURE P 12.2
9
Ir
=
For 25° ≤ ø' ≤ 45°, µs = 0.1 +0.3 (25¹), A = 0.005 (1 – $¹_25")
'-25°
q'
{
20°
20° Pa
Es
2(1+μ₂)q'tand'
4) Coyle and Castello's method (Use Figure 12.20 for extrapolation of Na)
Sand: Qp = q'N Ap
Concrete pile
460 mm X 460 mm
Loose sand
φί = 30°
y = 18.6 kN/m³
Dense sand
$'2 = 42°
y = 18.5 kN/m³
expand button
Transcribed Image Text:A 20 m long concrete pile with a rectangular cross section of 460 mm × 460 mm fully embedded in sand is shown in Figure P 12.2. Estimate the ultimate point load or tip resistance Qp by each of the following 4 methods and discuss. Necessary variables and formulae: Area of the pile tip Effective vertical stress at the level of the pile tip Atmospheric pressure 100 kN/m² Ap q' Pa o'o Irr Ir A Ms Mean effective normal ground stress at the level of the pile point Reduced rigidity index for the soil Rigidity index for the soil Average volumetric strain in the plastic zone below the pile point Poisson's ratio of soil 1) Terzaghi's method (Use Ng = 2) Meyerhof's method (Use Table 12.6 for interpolation of Na) Sand: Qp = min (q', 0.5påtanp') · No Ap 3) Vesic's method (Use Table 12.8 for interpolation of N and modulus of elasticity of soil of Es = 600pa) Sand: Qp = ¯'。No Ap where ' = 0 exp[(37-4¹) tand 2 1-sin o' 1+2Ko 3 q', K. = 1 - sino', Irr = 20 m Ir 1+1,Δ FIGURE P 12.2 9 Ir = For 25° ≤ ø' ≤ 45°, µs = 0.1 +0.3 (25¹), A = 0.005 (1 – $¹_25") '-25° q' { 20° 20° Pa Es 2(1+μ₂)q'tand' 4) Coyle and Castello's method (Use Figure 12.20 for extrapolation of Na) Sand: Qp = q'N Ap Concrete pile 460 mm X 460 mm Loose sand φί = 30° y = 18.6 kN/m³ Dense sand $'2 = 42° y = 18.5 kN/m³
TABLE 12.6 Interpolated Values of Ng Based on
Meyerhof's Theory
25
26
27
28
29
Soil friction angle, ø' (deg)
20
21
22
23
24
25
26
27
28
29
30
31
32
33
34
35
36
37
38
10
39
40
41
42
43
20
44
45
TABLE 12.8 Bearing Capacity Factors N. Based on the Theory of Expansion of Cavities
15.95
17.47
19.12
20.91
22.85
24.95
27.22
29.68
32.34
35.21
38.32
41.68
45.31
49.24
53.50
58.10
63.07
68.46
74.30
80.62
87.48
N₂
12.4
13.8
15.5
17.9
21.4
26.0
29.5
34.0
39.7
46.5
56.7
68.2
81.0
96.0
40
115.0
143.0
168.0
194.0
231.0
60
276.0
346.0
420.0
525.0
650.0
780.0
930.0
Embedment ratio, L/D
0
ITT
10
20
30
40
50
60
70
10
T
T
T
Bearing capacity factor, N*
9
20
40 60 80 100
$' = 30°
80
300
400
12.12
20.98
24.64
27.61
39.70
46.61
52.24
13.18
23.15
27.30
30.69
44.53
52.51
59.02
14.33
25.52
30.21
34.06
49.88
59.05
66.56
15.57
28.10
33.40
37.75
55.77
66.29
74.93
16.90
30.90
36.87
41.79
62.27
74.30
84.21
30
18.24
33.95
40.66
46.21
69.43
83.14
94.48
31
19.88
37.27
44.79
51.03
77.31
92.90
105.84
32
21.55
40.88
49.30
56.30
85.96
103.66
118.39
33
23.34
44.80
54.20
62.05
95.46
115.51
132.24
34
25.28
49.05
59.54
68.33
105.90
128.55
147.51
35
27.36
53.67
65.36
75.17
117.33
142.89
164.33
36
29.60
58.68
71.69
82.62
129.87
158.65
182.85
37
32.02
64.13
78.57
90.75
143.61
175.95
203.23
38
34.63
70.03
86.05
99.60
158.65
194.94
225.62
39
37.44
76.45
94.20
109.24
175.11
215.78
250.23
40
40.47
83.40
103.05
119.74
193.13
238.62
277.26
41
43.74
90.96
112.68
131.18
212.84
263.67
306.94
42
47.27
99.16
123.16
143.64
234.40
291.13
339.52
43
51.08
108.08
134.56
157.21
257.99
321.22
375.28
44
55.20
117.76
146.97
172.00
283.80
354.20
414.51
45
59.66
128.28
160.48
188.12
312.03
390.35
457.57
Based on data from "Design of Pile Foundations," by A. S. Vesic. Synthesis of Highway Practice by American Association of State Highway and Transportation, 1977
32° 36°
100
30.16
33.60
37.37
41.51
46.05
51.02
56.46
62.41
68.92
76.02
83.78
92.24
101.48
111.56
122.54
134.52
147.59
161.83
177.36
194.31
212.79
34°
FIGURE 12.20 Variation of N with L/D
(Based on Coyle and Castello, 1981)
38°
40°
200
200
500
57.06
64.62
73.04
82.40
92.80
104.33
117.11
131.24
146.87
164.12
183.16
204.14
227.26
252.71
280.71
311.50
345.34
382.53
423.39
468.28
517.58
expand button
Transcribed Image Text:TABLE 12.6 Interpolated Values of Ng Based on Meyerhof's Theory 25 26 27 28 29 Soil friction angle, ø' (deg) 20 21 22 23 24 25 26 27 28 29 30 31 32 33 34 35 36 37 38 10 39 40 41 42 43 20 44 45 TABLE 12.8 Bearing Capacity Factors N. Based on the Theory of Expansion of Cavities 15.95 17.47 19.12 20.91 22.85 24.95 27.22 29.68 32.34 35.21 38.32 41.68 45.31 49.24 53.50 58.10 63.07 68.46 74.30 80.62 87.48 N₂ 12.4 13.8 15.5 17.9 21.4 26.0 29.5 34.0 39.7 46.5 56.7 68.2 81.0 96.0 40 115.0 143.0 168.0 194.0 231.0 60 276.0 346.0 420.0 525.0 650.0 780.0 930.0 Embedment ratio, L/D 0 ITT 10 20 30 40 50 60 70 10 T T T Bearing capacity factor, N* 9 20 40 60 80 100 $' = 30° 80 300 400 12.12 20.98 24.64 27.61 39.70 46.61 52.24 13.18 23.15 27.30 30.69 44.53 52.51 59.02 14.33 25.52 30.21 34.06 49.88 59.05 66.56 15.57 28.10 33.40 37.75 55.77 66.29 74.93 16.90 30.90 36.87 41.79 62.27 74.30 84.21 30 18.24 33.95 40.66 46.21 69.43 83.14 94.48 31 19.88 37.27 44.79 51.03 77.31 92.90 105.84 32 21.55 40.88 49.30 56.30 85.96 103.66 118.39 33 23.34 44.80 54.20 62.05 95.46 115.51 132.24 34 25.28 49.05 59.54 68.33 105.90 128.55 147.51 35 27.36 53.67 65.36 75.17 117.33 142.89 164.33 36 29.60 58.68 71.69 82.62 129.87 158.65 182.85 37 32.02 64.13 78.57 90.75 143.61 175.95 203.23 38 34.63 70.03 86.05 99.60 158.65 194.94 225.62 39 37.44 76.45 94.20 109.24 175.11 215.78 250.23 40 40.47 83.40 103.05 119.74 193.13 238.62 277.26 41 43.74 90.96 112.68 131.18 212.84 263.67 306.94 42 47.27 99.16 123.16 143.64 234.40 291.13 339.52 43 51.08 108.08 134.56 157.21 257.99 321.22 375.28 44 55.20 117.76 146.97 172.00 283.80 354.20 414.51 45 59.66 128.28 160.48 188.12 312.03 390.35 457.57 Based on data from "Design of Pile Foundations," by A. S. Vesic. Synthesis of Highway Practice by American Association of State Highway and Transportation, 1977 32° 36° 100 30.16 33.60 37.37 41.51 46.05 51.02 56.46 62.41 68.92 76.02 83.78 92.24 101.48 111.56 122.54 134.52 147.59 161.83 177.36 194.31 212.79 34° FIGURE 12.20 Variation of N with L/D (Based on Coyle and Castello, 1981) 38° 40° 200 200 500 57.06 64.62 73.04 82.40 92.80 104.33 117.11 131.24 146.87 164.12 183.16 204.14 227.26 252.71 280.71 311.50 345.34 382.53 423.39 468.28 517.58
Solution
Bartleby Expert
by Bartleby Expert
SEE SOLUTION
Follow-up Question

I need detailed explanation to solve the exercise below. There are some formulas and hints, I also added some tables from the book.
Meyerhof's method, Coyle and Castello's method and Vesic's method were already solved.
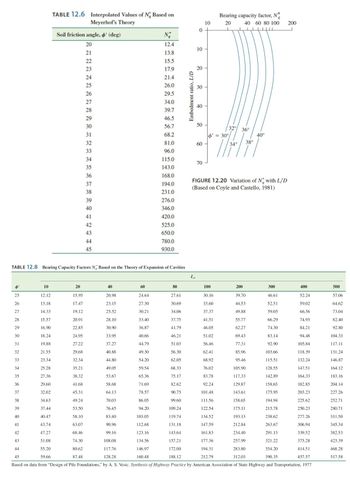
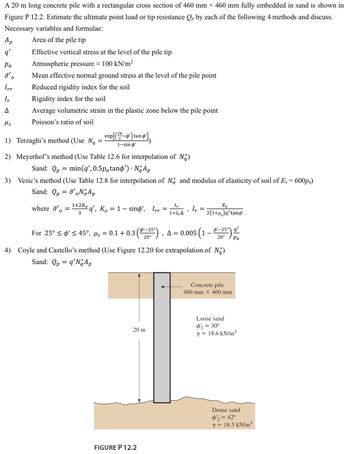
TABLE 12.6 Interpolated Values of Ng Based on
Meyerhof's Theory
25
26
27
28
29
Soil friction angle, ø' (deg)
20
21
22
23
24
25
26
27
28
29
30
31
32
33
34
35
36
37
38
10
39
40
41
42
43
20
44
45
TABLE 12.8 Bearing Capacity Factors N. Based on the Theory of Expansion of Cavities
15.95
17.47
19.12
20.91
22.85
24.95
27.22
29.68
32.34
35.21
38.32
41.68
45.31
49.24
53.50
58.10
63.07
68.46
74.30
80.62
87.48
N₂
12.4
13.8
15.5
17.9
21.4
26.0
29.5
34.0
39.7
46.5
56.7
68.2
81.0
96.0
40
115.0
143.0
168.0
194.0
231.0
60
276.0
346.0
420.0
525.0
650.0
780.0
930.0
Embedment ratio, L/D
0
ITT
10
20
30
40
50
60
70
10
T
T
T
Bearing capacity factor, N*
9
20
40 60 80 100
$' = 30°
80
300
400
12.12
20.98
24.64
27.61
39.70
46.61
52.24
13.18
23.15
27.30
30.69
44.53
52.51
59.02
14.33
25.52
30.21
34.06
49.88
59.05
66.56
15.57
28.10
33.40
37.75
55.77
66.29
74.93
16.90
30.90
36.87
41.79
62.27
74.30
84.21
30
18.24
33.95
40.66
46.21
69.43
83.14
94.48
31
19.88
37.27
44.79
51.03
77.31
92.90
105.84
32
21.55
40.88
49.30
56.30
85.96
103.66
118.39
33
23.34
44.80
54.20
62.05
95.46
115.51
132.24
34
25.28
49.05
59.54
68.33
105.90
128.55
147.51
35
27.36
53.67
65.36
75.17
117.33
142.89
164.33
36
29.60
58.68
71.69
82.62
129.87
158.65
182.85
37
32.02
64.13
78.57
90.75
143.61
175.95
203.23
38
34.63
70.03
86.05
99.60
158.65
194.94
225.62
39
37.44
76.45
94.20
109.24
175.11
215.78
250.23
40
40.47
83.40
103.05
119.74
193.13
238.62
277.26
41
43.74
90.96
112.68
131.18
212.84
263.67
306.94
42
47.27
99.16
123.16
143.64
234.40
291.13
339.52
43
51.08
108.08
134.56
157.21
257.99
321.22
375.28
44
55.20
117.76
146.97
172.00
283.80
354.20
414.51
45
59.66
128.28
160.48
188.12
312.03
390.35
457.57
Based on data from "Design of Pile Foundations," by A. S. Vesic. Synthesis of Highway Practice by American Association of State Highway and Transportation, 1977
32° 36°
100
30.16
33.60
37.37
41.51
46.05
51.02
56.46
62.41
68.92
76.02
83.78
92.24
101.48
111.56
122.54
134.52
147.59
161.83
177.36
194.31
212.79
34°
FIGURE 12.20 Variation of N with L/D
(Based on Coyle and Castello, 1981)
38°
40°
200
200
500
57.06
64.62
73.04
82.40
92.80
104.33
117.11
131.24
146.87
164.12
183.16
204.14
227.26
252.71
280.71
311.50
345.34
382.53
423.39
468.28
517.58
expand button
Transcribed Image Text:TABLE 12.6 Interpolated Values of Ng Based on Meyerhof's Theory 25 26 27 28 29 Soil friction angle, ø' (deg) 20 21 22 23 24 25 26 27 28 29 30 31 32 33 34 35 36 37 38 10 39 40 41 42 43 20 44 45 TABLE 12.8 Bearing Capacity Factors N. Based on the Theory of Expansion of Cavities 15.95 17.47 19.12 20.91 22.85 24.95 27.22 29.68 32.34 35.21 38.32 41.68 45.31 49.24 53.50 58.10 63.07 68.46 74.30 80.62 87.48 N₂ 12.4 13.8 15.5 17.9 21.4 26.0 29.5 34.0 39.7 46.5 56.7 68.2 81.0 96.0 40 115.0 143.0 168.0 194.0 231.0 60 276.0 346.0 420.0 525.0 650.0 780.0 930.0 Embedment ratio, L/D 0 ITT 10 20 30 40 50 60 70 10 T T T Bearing capacity factor, N* 9 20 40 60 80 100 $' = 30° 80 300 400 12.12 20.98 24.64 27.61 39.70 46.61 52.24 13.18 23.15 27.30 30.69 44.53 52.51 59.02 14.33 25.52 30.21 34.06 49.88 59.05 66.56 15.57 28.10 33.40 37.75 55.77 66.29 74.93 16.90 30.90 36.87 41.79 62.27 74.30 84.21 30 18.24 33.95 40.66 46.21 69.43 83.14 94.48 31 19.88 37.27 44.79 51.03 77.31 92.90 105.84 32 21.55 40.88 49.30 56.30 85.96 103.66 118.39 33 23.34 44.80 54.20 62.05 95.46 115.51 132.24 34 25.28 49.05 59.54 68.33 105.90 128.55 147.51 35 27.36 53.67 65.36 75.17 117.33 142.89 164.33 36 29.60 58.68 71.69 82.62 129.87 158.65 182.85 37 32.02 64.13 78.57 90.75 143.61 175.95 203.23 38 34.63 70.03 86.05 99.60 158.65 194.94 225.62 39 37.44 76.45 94.20 109.24 175.11 215.78 250.23 40 40.47 83.40 103.05 119.74 193.13 238.62 277.26 41 43.74 90.96 112.68 131.18 212.84 263.67 306.94 42 47.27 99.16 123.16 143.64 234.40 291.13 339.52 43 51.08 108.08 134.56 157.21 257.99 321.22 375.28 44 55.20 117.76 146.97 172.00 283.80 354.20 414.51 45 59.66 128.28 160.48 188.12 312.03 390.35 457.57 Based on data from "Design of Pile Foundations," by A. S. Vesic. Synthesis of Highway Practice by American Association of State Highway and Transportation, 1977 32° 36° 100 30.16 33.60 37.37 41.51 46.05 51.02 56.46 62.41 68.92 76.02 83.78 92.24 101.48 111.56 122.54 134.52 147.59 161.83 177.36 194.31 212.79 34° FIGURE 12.20 Variation of N with L/D (Based on Coyle and Castello, 1981) 38° 40° 200 200 500 57.06 64.62 73.04 82.40 92.80 104.33 117.11 131.24 146.87 164.12 183.16 204.14 227.26 252.71 280.71 311.50 345.34 382.53 423.39 468.28 517.58
A 20 m long concrete pile with a rectangular cross section of 460 mm × 460 mm fully embedded in sand is shown in
Figure P 12.2. Estimate the ultimate point load or tip resistance Qp by each of the following 4 methods and discuss.
Necessary variables and formulae:
Area of the pile tip
Effective vertical stress at the level of the pile tip
Atmospheric pressure 100 kN/m²
Ap
q'
Pa
o'o
Irr
Ir
A
Ms
Mean effective normal ground stress at the level of the pile point
Reduced rigidity index for the soil
Rigidity index for the soil
Average volumetric strain in the plastic zone below the pile point
Poisson's ratio of soil
1) Terzaghi's method (Use Ng
=
2) Meyerhof's method (Use Table 12.6 for interpolation of Na)
Sand: Qp = min (q', 0.5påtanp') · No Ap
3) Vesic's method (Use Table 12.8 for interpolation of N and modulus of elasticity of soil of Es = 600pa)
Sand: Qp = ¯'。No Ap
where ' =
0
exp[(37-4¹) tand
2
1-sin o'
1+2Ko
3
q', K. = 1 - sino', Irr
=
20 m
Ir
1+1,Δ
FIGURE P 12.2
9
Ir
=
For 25° ≤ ø' ≤ 45°, µs = 0.1 +0.3 (25¹), A = 0.005 (1 – $¹_25")
'-25°
q'
{
20°
20° Pa
Es
2(1+μ₂)q'tand'
4) Coyle and Castello's method (Use Figure 12.20 for extrapolation of Na)
Sand: Qp = q'N Ap
Concrete pile
460 mm X 460 mm
Loose sand
φί = 30°
y = 18.6 kN/m³
Dense sand
$'2 = 42°
y = 18.5 kN/m³
expand button
Transcribed Image Text:A 20 m long concrete pile with a rectangular cross section of 460 mm × 460 mm fully embedded in sand is shown in Figure P 12.2. Estimate the ultimate point load or tip resistance Qp by each of the following 4 methods and discuss. Necessary variables and formulae: Area of the pile tip Effective vertical stress at the level of the pile tip Atmospheric pressure 100 kN/m² Ap q' Pa o'o Irr Ir A Ms Mean effective normal ground stress at the level of the pile point Reduced rigidity index for the soil Rigidity index for the soil Average volumetric strain in the plastic zone below the pile point Poisson's ratio of soil 1) Terzaghi's method (Use Ng = 2) Meyerhof's method (Use Table 12.6 for interpolation of Na) Sand: Qp = min (q', 0.5påtanp') · No Ap 3) Vesic's method (Use Table 12.8 for interpolation of N and modulus of elasticity of soil of Es = 600pa) Sand: Qp = ¯'。No Ap where ' = 0 exp[(37-4¹) tand 2 1-sin o' 1+2Ko 3 q', K. = 1 - sino', Irr = 20 m Ir 1+1,Δ FIGURE P 12.2 9 Ir = For 25° ≤ ø' ≤ 45°, µs = 0.1 +0.3 (25¹), A = 0.005 (1 – $¹_25") '-25° q' { 20° 20° Pa Es 2(1+μ₂)q'tand' 4) Coyle and Castello's method (Use Figure 12.20 for extrapolation of Na) Sand: Qp = q'N Ap Concrete pile 460 mm X 460 mm Loose sand φί = 30° y = 18.6 kN/m³ Dense sand $'2 = 42° y = 18.5 kN/m³
Solution
Bartleby Expert
by Bartleby Expert
SEE SOLUTION
Follow-up Question

I need detailed explanation to solve the exercise below. There are some formulas and hints, I also added some tables from the book.
Meyerhof's method, Coyle and Castello's method and Vesic's method were already solved.
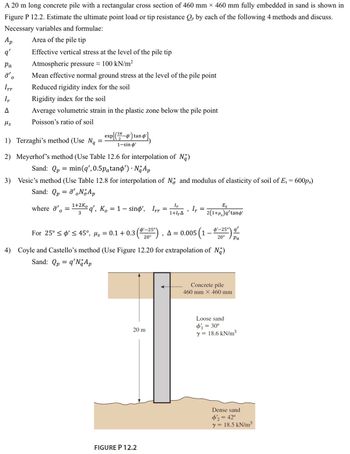
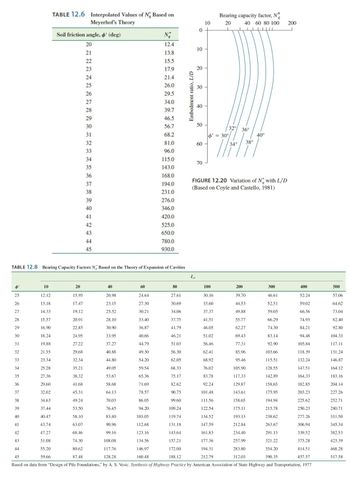
A 20 m long concrete pile with a rectangular cross section of 460 mm × 460 mm fully embedded in sand is shown in
Figure P 12.2. Estimate the ultimate point load or tip resistance Qp by each of the following 4 methods and discuss.
Necessary variables and formulae:
Area of the pile tip
Effective vertical stress at the level of the pile tip
Atmospheric pressure 100 kN/m²
Ap
q'
Pa
o'o
Irr
Ir
A
Ms
Mean effective normal ground stress at the level of the pile point
Reduced rigidity index for the soil
Rigidity index for the soil
Average volumetric strain in the plastic zone below the pile point
Poisson's ratio of soil
1) Terzaghi's method (Use Ng
=
2) Meyerhof's method (Use Table 12.6 for interpolation of Na)
Sand: Qp = min (q', 0.5påtanp') · No Ap
3) Vesic's method (Use Table 12.8 for interpolation of N and modulus of elasticity of soil of Es = 600pa)
Sand: Qp = ¯'。No Ap
where ' =
0
exp[(37-4¹) tand
2
1-sin o'
1+2Ko
3
q', K. = 1 - sino', Irr
=
20 m
Ir
1+1,Δ
FIGURE P 12.2
9
Ir
=
For 25° ≤ ø' ≤ 45°, µs = 0.1 +0.3 (25¹), A = 0.005 (1 – $¹_25")
'-25°
q'
{
20°
20° Pa
Es
2(1+μ₂)q'tand'
4) Coyle and Castello's method (Use Figure 12.20 for extrapolation of Na)
Sand: Qp = q'N Ap
Concrete pile
460 mm X 460 mm
Loose sand
φί = 30°
y = 18.6 kN/m³
Dense sand
$'2 = 42°
y = 18.5 kN/m³
expand button
Transcribed Image Text:A 20 m long concrete pile with a rectangular cross section of 460 mm × 460 mm fully embedded in sand is shown in Figure P 12.2. Estimate the ultimate point load or tip resistance Qp by each of the following 4 methods and discuss. Necessary variables and formulae: Area of the pile tip Effective vertical stress at the level of the pile tip Atmospheric pressure 100 kN/m² Ap q' Pa o'o Irr Ir A Ms Mean effective normal ground stress at the level of the pile point Reduced rigidity index for the soil Rigidity index for the soil Average volumetric strain in the plastic zone below the pile point Poisson's ratio of soil 1) Terzaghi's method (Use Ng = 2) Meyerhof's method (Use Table 12.6 for interpolation of Na) Sand: Qp = min (q', 0.5påtanp') · No Ap 3) Vesic's method (Use Table 12.8 for interpolation of N and modulus of elasticity of soil of Es = 600pa) Sand: Qp = ¯'。No Ap where ' = 0 exp[(37-4¹) tand 2 1-sin o' 1+2Ko 3 q', K. = 1 - sino', Irr = 20 m Ir 1+1,Δ FIGURE P 12.2 9 Ir = For 25° ≤ ø' ≤ 45°, µs = 0.1 +0.3 (25¹), A = 0.005 (1 – $¹_25") '-25° q' { 20° 20° Pa Es 2(1+μ₂)q'tand' 4) Coyle and Castello's method (Use Figure 12.20 for extrapolation of Na) Sand: Qp = q'N Ap Concrete pile 460 mm X 460 mm Loose sand φί = 30° y = 18.6 kN/m³ Dense sand $'2 = 42° y = 18.5 kN/m³
TABLE 12.6 Interpolated Values of Ng Based on
Meyerhof's Theory
25
26
27
28
29
Soil friction angle, ø' (deg)
20
21
22
23
24
25
26
27
28
29
30
31
32
33
34
35
36
37
38
10
39
40
41
42
43
20
44
45
TABLE 12.8 Bearing Capacity Factors N. Based on the Theory of Expansion of Cavities
15.95
17.47
19.12
20.91
22.85
24.95
27.22
29.68
32.34
35.21
38.32
41.68
45.31
49.24
53.50
58.10
63.07
68.46
74.30
80.62
87.48
N₂
12.4
13.8
15.5
17.9
21.4
26.0
29.5
34.0
39.7
46.5
56.7
68.2
81.0
96.0
40
115.0
143.0
168.0
194.0
231.0
60
276.0
346.0
420.0
525.0
650.0
780.0
930.0
Embedment ratio, L/D
0
ITT
10
20
30
40
50
60
70
10
T
T
T
Bearing capacity factor, N*
9
20
40 60 80 100
$' = 30°
80
300
400
12.12
20.98
24.64
27.61
39.70
46.61
52.24
13.18
23.15
27.30
30.69
44.53
52.51
59.02
14.33
25.52
30.21
34.06
49.88
59.05
66.56
15.57
28.10
33.40
37.75
55.77
66.29
74.93
16.90
30.90
36.87
41.79
62.27
74.30
84.21
30
18.24
33.95
40.66
46.21
69.43
83.14
94.48
31
19.88
37.27
44.79
51.03
77.31
92.90
105.84
32
21.55
40.88
49.30
56.30
85.96
103.66
118.39
33
23.34
44.80
54.20
62.05
95.46
115.51
132.24
34
25.28
49.05
59.54
68.33
105.90
128.55
147.51
35
27.36
53.67
65.36
75.17
117.33
142.89
164.33
36
29.60
58.68
71.69
82.62
129.87
158.65
182.85
37
32.02
64.13
78.57
90.75
143.61
175.95
203.23
38
34.63
70.03
86.05
99.60
158.65
194.94
225.62
39
37.44
76.45
94.20
109.24
175.11
215.78
250.23
40
40.47
83.40
103.05
119.74
193.13
238.62
277.26
41
43.74
90.96
112.68
131.18
212.84
263.67
306.94
42
47.27
99.16
123.16
143.64
234.40
291.13
339.52
43
51.08
108.08
134.56
157.21
257.99
321.22
375.28
44
55.20
117.76
146.97
172.00
283.80
354.20
414.51
45
59.66
128.28
160.48
188.12
312.03
390.35
457.57
Based on data from "Design of Pile Foundations," by A. S. Vesic. Synthesis of Highway Practice by American Association of State Highway and Transportation, 1977
32° 36°
100
30.16
33.60
37.37
41.51
46.05
51.02
56.46
62.41
68.92
76.02
83.78
92.24
101.48
111.56
122.54
134.52
147.59
161.83
177.36
194.31
212.79
34°
FIGURE 12.20 Variation of N with L/D
(Based on Coyle and Castello, 1981)
38°
40°
200
200
500
57.06
64.62
73.04
82.40
92.80
104.33
117.11
131.24
146.87
164.12
183.16
204.14
227.26
252.71
280.71
311.50
345.34
382.53
423.39
468.28
517.58
expand button
Transcribed Image Text:TABLE 12.6 Interpolated Values of Ng Based on Meyerhof's Theory 25 26 27 28 29 Soil friction angle, ø' (deg) 20 21 22 23 24 25 26 27 28 29 30 31 32 33 34 35 36 37 38 10 39 40 41 42 43 20 44 45 TABLE 12.8 Bearing Capacity Factors N. Based on the Theory of Expansion of Cavities 15.95 17.47 19.12 20.91 22.85 24.95 27.22 29.68 32.34 35.21 38.32 41.68 45.31 49.24 53.50 58.10 63.07 68.46 74.30 80.62 87.48 N₂ 12.4 13.8 15.5 17.9 21.4 26.0 29.5 34.0 39.7 46.5 56.7 68.2 81.0 96.0 40 115.0 143.0 168.0 194.0 231.0 60 276.0 346.0 420.0 525.0 650.0 780.0 930.0 Embedment ratio, L/D 0 ITT 10 20 30 40 50 60 70 10 T T T Bearing capacity factor, N* 9 20 40 60 80 100 $' = 30° 80 300 400 12.12 20.98 24.64 27.61 39.70 46.61 52.24 13.18 23.15 27.30 30.69 44.53 52.51 59.02 14.33 25.52 30.21 34.06 49.88 59.05 66.56 15.57 28.10 33.40 37.75 55.77 66.29 74.93 16.90 30.90 36.87 41.79 62.27 74.30 84.21 30 18.24 33.95 40.66 46.21 69.43 83.14 94.48 31 19.88 37.27 44.79 51.03 77.31 92.90 105.84 32 21.55 40.88 49.30 56.30 85.96 103.66 118.39 33 23.34 44.80 54.20 62.05 95.46 115.51 132.24 34 25.28 49.05 59.54 68.33 105.90 128.55 147.51 35 27.36 53.67 65.36 75.17 117.33 142.89 164.33 36 29.60 58.68 71.69 82.62 129.87 158.65 182.85 37 32.02 64.13 78.57 90.75 143.61 175.95 203.23 38 34.63 70.03 86.05 99.60 158.65 194.94 225.62 39 37.44 76.45 94.20 109.24 175.11 215.78 250.23 40 40.47 83.40 103.05 119.74 193.13 238.62 277.26 41 43.74 90.96 112.68 131.18 212.84 263.67 306.94 42 47.27 99.16 123.16 143.64 234.40 291.13 339.52 43 51.08 108.08 134.56 157.21 257.99 321.22 375.28 44 55.20 117.76 146.97 172.00 283.80 354.20 414.51 45 59.66 128.28 160.48 188.12 312.03 390.35 457.57 Based on data from "Design of Pile Foundations," by A. S. Vesic. Synthesis of Highway Practice by American Association of State Highway and Transportation, 1977 32° 36° 100 30.16 33.60 37.37 41.51 46.05 51.02 56.46 62.41 68.92 76.02 83.78 92.24 101.48 111.56 122.54 134.52 147.59 161.83 177.36 194.31 212.79 34° FIGURE 12.20 Variation of N with L/D (Based on Coyle and Castello, 1981) 38° 40° 200 200 500 57.06 64.62 73.04 82.40 92.80 104.33 117.11 131.24 146.87 164.12 183.16 204.14 227.26 252.71 280.71 311.50 345.34 382.53 423.39 468.28 517.58
Solution
Bartleby Expert
by Bartleby Expert
SEE SOLUTION
Follow-up Question

I need detailed explanation to solve the exercise below. There are some formulas and hints, I also added some tables from the book.
Meyerhof's method, Coyle and Castello's method and Vesic's method were already solved.
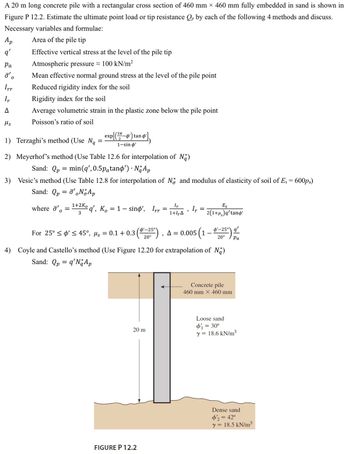
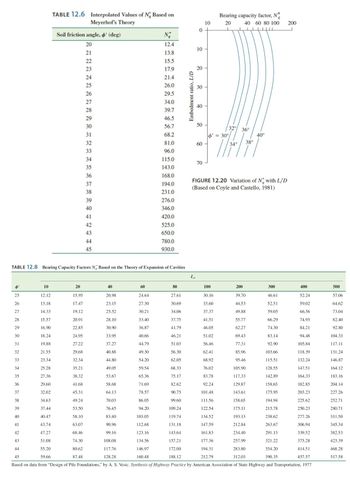
A 20 m long concrete pile with a rectangular cross section of 460 mm × 460 mm fully embedded in sand is shown in
Figure P 12.2. Estimate the ultimate point load or tip resistance Qp by each of the following 4 methods and discuss.
Necessary variables and formulae:
Area of the pile tip
Effective vertical stress at the level of the pile tip
Atmospheric pressure 100 kN/m²
Ap
q'
Pa
o'o
Irr
Ir
A
Ms
Mean effective normal ground stress at the level of the pile point
Reduced rigidity index for the soil
Rigidity index for the soil
Average volumetric strain in the plastic zone below the pile point
Poisson's ratio of soil
1) Terzaghi's method (Use Ng
=
2) Meyerhof's method (Use Table 12.6 for interpolation of Na)
Sand: Qp = min (q', 0.5påtanp') · No Ap
3) Vesic's method (Use Table 12.8 for interpolation of N and modulus of elasticity of soil of Es = 600pa)
Sand: Qp = ¯'。No Ap
where ' =
0
exp[(37-4¹) tand
2
1-sin o'
1+2Ko
3
q', K. = 1 - sino', Irr
=
20 m
Ir
1+1,Δ
FIGURE P 12.2
9
Ir
=
For 25° ≤ ø' ≤ 45°, µs = 0.1 +0.3 (25¹), A = 0.005 (1 – $¹_25")
'-25°
q'
{
20°
20° Pa
Es
2(1+μ₂)q'tand'
4) Coyle and Castello's method (Use Figure 12.20 for extrapolation of Na)
Sand: Qp = q'N Ap
Concrete pile
460 mm X 460 mm
Loose sand
φί = 30°
y = 18.6 kN/m³
Dense sand
$'2 = 42°
y = 18.5 kN/m³
expand button
Transcribed Image Text:A 20 m long concrete pile with a rectangular cross section of 460 mm × 460 mm fully embedded in sand is shown in Figure P 12.2. Estimate the ultimate point load or tip resistance Qp by each of the following 4 methods and discuss. Necessary variables and formulae: Area of the pile tip Effective vertical stress at the level of the pile tip Atmospheric pressure 100 kN/m² Ap q' Pa o'o Irr Ir A Ms Mean effective normal ground stress at the level of the pile point Reduced rigidity index for the soil Rigidity index for the soil Average volumetric strain in the plastic zone below the pile point Poisson's ratio of soil 1) Terzaghi's method (Use Ng = 2) Meyerhof's method (Use Table 12.6 for interpolation of Na) Sand: Qp = min (q', 0.5påtanp') · No Ap 3) Vesic's method (Use Table 12.8 for interpolation of N and modulus of elasticity of soil of Es = 600pa) Sand: Qp = ¯'。No Ap where ' = 0 exp[(37-4¹) tand 2 1-sin o' 1+2Ko 3 q', K. = 1 - sino', Irr = 20 m Ir 1+1,Δ FIGURE P 12.2 9 Ir = For 25° ≤ ø' ≤ 45°, µs = 0.1 +0.3 (25¹), A = 0.005 (1 – $¹_25") '-25° q' { 20° 20° Pa Es 2(1+μ₂)q'tand' 4) Coyle and Castello's method (Use Figure 12.20 for extrapolation of Na) Sand: Qp = q'N Ap Concrete pile 460 mm X 460 mm Loose sand φί = 30° y = 18.6 kN/m³ Dense sand $'2 = 42° y = 18.5 kN/m³
TABLE 12.6 Interpolated Values of Ng Based on
Meyerhof's Theory
25
26
27
28
29
Soil friction angle, ø' (deg)
20
21
22
23
24
25
26
27
28
29
30
31
32
33
34
35
36
37
38
10
39
40
41
42
43
20
44
45
TABLE 12.8 Bearing Capacity Factors N. Based on the Theory of Expansion of Cavities
15.95
17.47
19.12
20.91
22.85
24.95
27.22
29.68
32.34
35.21
38.32
41.68
45.31
49.24
53.50
58.10
63.07
68.46
74.30
80.62
87.48
N₂
12.4
13.8
15.5
17.9
21.4
26.0
29.5
34.0
39.7
46.5
56.7
68.2
81.0
96.0
40
115.0
143.0
168.0
194.0
231.0
60
276.0
346.0
420.0
525.0
650.0
780.0
930.0
Embedment ratio, L/D
0
ITT
10
20
30
40
50
60
70
10
T
T
T
Bearing capacity factor, N*
9
20
40 60 80 100
$' = 30°
80
300
400
12.12
20.98
24.64
27.61
39.70
46.61
52.24
13.18
23.15
27.30
30.69
44.53
52.51
59.02
14.33
25.52
30.21
34.06
49.88
59.05
66.56
15.57
28.10
33.40
37.75
55.77
66.29
74.93
16.90
30.90
36.87
41.79
62.27
74.30
84.21
30
18.24
33.95
40.66
46.21
69.43
83.14
94.48
31
19.88
37.27
44.79
51.03
77.31
92.90
105.84
32
21.55
40.88
49.30
56.30
85.96
103.66
118.39
33
23.34
44.80
54.20
62.05
95.46
115.51
132.24
34
25.28
49.05
59.54
68.33
105.90
128.55
147.51
35
27.36
53.67
65.36
75.17
117.33
142.89
164.33
36
29.60
58.68
71.69
82.62
129.87
158.65
182.85
37
32.02
64.13
78.57
90.75
143.61
175.95
203.23
38
34.63
70.03
86.05
99.60
158.65
194.94
225.62
39
37.44
76.45
94.20
109.24
175.11
215.78
250.23
40
40.47
83.40
103.05
119.74
193.13
238.62
277.26
41
43.74
90.96
112.68
131.18
212.84
263.67
306.94
42
47.27
99.16
123.16
143.64
234.40
291.13
339.52
43
51.08
108.08
134.56
157.21
257.99
321.22
375.28
44
55.20
117.76
146.97
172.00
283.80
354.20
414.51
45
59.66
128.28
160.48
188.12
312.03
390.35
457.57
Based on data from "Design of Pile Foundations," by A. S. Vesic. Synthesis of Highway Practice by American Association of State Highway and Transportation, 1977
32° 36°
100
30.16
33.60
37.37
41.51
46.05
51.02
56.46
62.41
68.92
76.02
83.78
92.24
101.48
111.56
122.54
134.52
147.59
161.83
177.36
194.31
212.79
34°
FIGURE 12.20 Variation of N with L/D
(Based on Coyle and Castello, 1981)
38°
40°
200
200
500
57.06
64.62
73.04
82.40
92.80
104.33
117.11
131.24
146.87
164.12
183.16
204.14
227.26
252.71
280.71
311.50
345.34
382.53
423.39
468.28
517.58
expand button
Transcribed Image Text:TABLE 12.6 Interpolated Values of Ng Based on Meyerhof's Theory 25 26 27 28 29 Soil friction angle, ø' (deg) 20 21 22 23 24 25 26 27 28 29 30 31 32 33 34 35 36 37 38 10 39 40 41 42 43 20 44 45 TABLE 12.8 Bearing Capacity Factors N. Based on the Theory of Expansion of Cavities 15.95 17.47 19.12 20.91 22.85 24.95 27.22 29.68 32.34 35.21 38.32 41.68 45.31 49.24 53.50 58.10 63.07 68.46 74.30 80.62 87.48 N₂ 12.4 13.8 15.5 17.9 21.4 26.0 29.5 34.0 39.7 46.5 56.7 68.2 81.0 96.0 40 115.0 143.0 168.0 194.0 231.0 60 276.0 346.0 420.0 525.0 650.0 780.0 930.0 Embedment ratio, L/D 0 ITT 10 20 30 40 50 60 70 10 T T T Bearing capacity factor, N* 9 20 40 60 80 100 $' = 30° 80 300 400 12.12 20.98 24.64 27.61 39.70 46.61 52.24 13.18 23.15 27.30 30.69 44.53 52.51 59.02 14.33 25.52 30.21 34.06 49.88 59.05 66.56 15.57 28.10 33.40 37.75 55.77 66.29 74.93 16.90 30.90 36.87 41.79 62.27 74.30 84.21 30 18.24 33.95 40.66 46.21 69.43 83.14 94.48 31 19.88 37.27 44.79 51.03 77.31 92.90 105.84 32 21.55 40.88 49.30 56.30 85.96 103.66 118.39 33 23.34 44.80 54.20 62.05 95.46 115.51 132.24 34 25.28 49.05 59.54 68.33 105.90 128.55 147.51 35 27.36 53.67 65.36 75.17 117.33 142.89 164.33 36 29.60 58.68 71.69 82.62 129.87 158.65 182.85 37 32.02 64.13 78.57 90.75 143.61 175.95 203.23 38 34.63 70.03 86.05 99.60 158.65 194.94 225.62 39 37.44 76.45 94.20 109.24 175.11 215.78 250.23 40 40.47 83.40 103.05 119.74 193.13 238.62 277.26 41 43.74 90.96 112.68 131.18 212.84 263.67 306.94 42 47.27 99.16 123.16 143.64 234.40 291.13 339.52 43 51.08 108.08 134.56 157.21 257.99 321.22 375.28 44 55.20 117.76 146.97 172.00 283.80 354.20 414.51 45 59.66 128.28 160.48 188.12 312.03 390.35 457.57 Based on data from "Design of Pile Foundations," by A. S. Vesic. Synthesis of Highway Practice by American Association of State Highway and Transportation, 1977 32° 36° 100 30.16 33.60 37.37 41.51 46.05 51.02 56.46 62.41 68.92 76.02 83.78 92.24 101.48 111.56 122.54 134.52 147.59 161.83 177.36 194.31 212.79 34° FIGURE 12.20 Variation of N with L/D (Based on Coyle and Castello, 1981) 38° 40° 200 200 500 57.06 64.62 73.04 82.40 92.80 104.33 117.11 131.24 146.87 164.12 183.16 204.14 227.26 252.71 280.71 311.50 345.34 382.53 423.39 468.28 517.58
Solution
Bartleby Expert
by Bartleby Expert
SEE SOLUTION
Follow-up Questions
Read through expert solutions to related follow-up questions below.
Follow-up Question

I need detailed explanation to solve the exercise below. There are some formulas and hints, I also added some tables from the book.
Meyerhof's method, Coyle and Castello's method and Vesic's method were already solved.

A 20 m long concrete pile with a rectangular cross section of 460 mm × 460 mm fully embedded in sand is shown in
Figure P 12.2. Estimate the ultimate point load or tip resistance Qp by each of the following 4 methods and discuss.
Necessary variables and formulae:
Area of the pile tip
Effective vertical stress at the level of the pile tip
Atmospheric pressure 100 kN/m²
Ap
q'
Pa
o'o
Irr
Ir
A
Ms
Mean effective normal ground stress at the level of the pile point
Reduced rigidity index for the soil
Rigidity index for the soil
Average volumetric strain in the plastic zone below the pile point
Poisson's ratio of soil
1) Terzaghi's method (Use Ng
=
2) Meyerhof's method (Use Table 12.6 for interpolation of Na)
Sand: Qp = min (q', 0.5påtanp') · No Ap
3) Vesic's method (Use Table 12.8 for interpolation of N and modulus of elasticity of soil of Es = 600pa)
Sand: Qp = ¯'。No Ap
where ' =
0
exp[(37-4¹) tand
2
1-sin o'
1+2Ko
3
q', K. = 1 - sino', Irr
=
20 m
Ir
1+1,Δ
FIGURE P 12.2
9
Ir
=
For 25° ≤ ø' ≤ 45°, µs = 0.1 +0.3 (25¹), A = 0.005 (1 – $¹_25")
'-25°
q'
{
20°
20° Pa
Es
2(1+μ₂)q'tand'
4) Coyle and Castello's method (Use Figure 12.20 for extrapolation of Na)
Sand: Qp = q'N Ap
Concrete pile
460 mm X 460 mm
Loose sand
φί = 30°
y = 18.6 kN/m³
Dense sand
$'2 = 42°
y = 18.5 kN/m³
expand button
Transcribed Image Text:A 20 m long concrete pile with a rectangular cross section of 460 mm × 460 mm fully embedded in sand is shown in Figure P 12.2. Estimate the ultimate point load or tip resistance Qp by each of the following 4 methods and discuss. Necessary variables and formulae: Area of the pile tip Effective vertical stress at the level of the pile tip Atmospheric pressure 100 kN/m² Ap q' Pa o'o Irr Ir A Ms Mean effective normal ground stress at the level of the pile point Reduced rigidity index for the soil Rigidity index for the soil Average volumetric strain in the plastic zone below the pile point Poisson's ratio of soil 1) Terzaghi's method (Use Ng = 2) Meyerhof's method (Use Table 12.6 for interpolation of Na) Sand: Qp = min (q', 0.5påtanp') · No Ap 3) Vesic's method (Use Table 12.8 for interpolation of N and modulus of elasticity of soil of Es = 600pa) Sand: Qp = ¯'。No Ap where ' = 0 exp[(37-4¹) tand 2 1-sin o' 1+2Ko 3 q', K. = 1 - sino', Irr = 20 m Ir 1+1,Δ FIGURE P 12.2 9 Ir = For 25° ≤ ø' ≤ 45°, µs = 0.1 +0.3 (25¹), A = 0.005 (1 – $¹_25") '-25° q' { 20° 20° Pa Es 2(1+μ₂)q'tand' 4) Coyle and Castello's method (Use Figure 12.20 for extrapolation of Na) Sand: Qp = q'N Ap Concrete pile 460 mm X 460 mm Loose sand φί = 30° y = 18.6 kN/m³ Dense sand $'2 = 42° y = 18.5 kN/m³
TABLE 12.6 Interpolated Values of Ng Based on
Meyerhof's Theory
25
26
27
28
29
Soil friction angle, ø' (deg)
20
21
22
23
24
25
26
27
28
29
30
31
32
33
34
35
36
37
38
10
39
40
41
42
43
20
44
45
TABLE 12.8 Bearing Capacity Factors N. Based on the Theory of Expansion of Cavities
15.95
17.47
19.12
20.91
22.85
24.95
27.22
29.68
32.34
35.21
38.32
41.68
45.31
49.24
53.50
58.10
63.07
68.46
74.30
80.62
87.48
N₂
12.4
13.8
15.5
17.9
21.4
26.0
29.5
34.0
39.7
46.5
56.7
68.2
81.0
96.0
40
115.0
143.0
168.0
194.0
231.0
60
276.0
346.0
420.0
525.0
650.0
780.0
930.0
Embedment ratio, L/D
0
ITT
10
20
30
40
50
60
70
10
T
T
T
Bearing capacity factor, N*
9
20
40 60 80 100
$' = 30°
80
300
400
12.12
20.98
24.64
27.61
39.70
46.61
52.24
13.18
23.15
27.30
30.69
44.53
52.51
59.02
14.33
25.52
30.21
34.06
49.88
59.05
66.56
15.57
28.10
33.40
37.75
55.77
66.29
74.93
16.90
30.90
36.87
41.79
62.27
74.30
84.21
30
18.24
33.95
40.66
46.21
69.43
83.14
94.48
31
19.88
37.27
44.79
51.03
77.31
92.90
105.84
32
21.55
40.88
49.30
56.30
85.96
103.66
118.39
33
23.34
44.80
54.20
62.05
95.46
115.51
132.24
34
25.28
49.05
59.54
68.33
105.90
128.55
147.51
35
27.36
53.67
65.36
75.17
117.33
142.89
164.33
36
29.60
58.68
71.69
82.62
129.87
158.65
182.85
37
32.02
64.13
78.57
90.75
143.61
175.95
203.23
38
34.63
70.03
86.05
99.60
158.65
194.94
225.62
39
37.44
76.45
94.20
109.24
175.11
215.78
250.23
40
40.47
83.40
103.05
119.74
193.13
238.62
277.26
41
43.74
90.96
112.68
131.18
212.84
263.67
306.94
42
47.27
99.16
123.16
143.64
234.40
291.13
339.52
43
51.08
108.08
134.56
157.21
257.99
321.22
375.28
44
55.20
117.76
146.97
172.00
283.80
354.20
414.51
45
59.66
128.28
160.48
188.12
312.03
390.35
457.57
Based on data from "Design of Pile Foundations," by A. S. Vesic. Synthesis of Highway Practice by American Association of State Highway and Transportation, 1977
32° 36°
100
30.16
33.60
37.37
41.51
46.05
51.02
56.46
62.41
68.92
76.02
83.78
92.24
101.48
111.56
122.54
134.52
147.59
161.83
177.36
194.31
212.79
34°
FIGURE 12.20 Variation of N with L/D
(Based on Coyle and Castello, 1981)
38°
40°
200
200
500
57.06
64.62
73.04
82.40
92.80
104.33
117.11
131.24
146.87
164.12
183.16
204.14
227.26
252.71
280.71
311.50
345.34
382.53
423.39
468.28
517.58
expand button
Transcribed Image Text:TABLE 12.6 Interpolated Values of Ng Based on Meyerhof's Theory 25 26 27 28 29 Soil friction angle, ø' (deg) 20 21 22 23 24 25 26 27 28 29 30 31 32 33 34 35 36 37 38 10 39 40 41 42 43 20 44 45 TABLE 12.8 Bearing Capacity Factors N. Based on the Theory of Expansion of Cavities 15.95 17.47 19.12 20.91 22.85 24.95 27.22 29.68 32.34 35.21 38.32 41.68 45.31 49.24 53.50 58.10 63.07 68.46 74.30 80.62 87.48 N₂ 12.4 13.8 15.5 17.9 21.4 26.0 29.5 34.0 39.7 46.5 56.7 68.2 81.0 96.0 40 115.0 143.0 168.0 194.0 231.0 60 276.0 346.0 420.0 525.0 650.0 780.0 930.0 Embedment ratio, L/D 0 ITT 10 20 30 40 50 60 70 10 T T T Bearing capacity factor, N* 9 20 40 60 80 100 $' = 30° 80 300 400 12.12 20.98 24.64 27.61 39.70 46.61 52.24 13.18 23.15 27.30 30.69 44.53 52.51 59.02 14.33 25.52 30.21 34.06 49.88 59.05 66.56 15.57 28.10 33.40 37.75 55.77 66.29 74.93 16.90 30.90 36.87 41.79 62.27 74.30 84.21 30 18.24 33.95 40.66 46.21 69.43 83.14 94.48 31 19.88 37.27 44.79 51.03 77.31 92.90 105.84 32 21.55 40.88 49.30 56.30 85.96 103.66 118.39 33 23.34 44.80 54.20 62.05 95.46 115.51 132.24 34 25.28 49.05 59.54 68.33 105.90 128.55 147.51 35 27.36 53.67 65.36 75.17 117.33 142.89 164.33 36 29.60 58.68 71.69 82.62 129.87 158.65 182.85 37 32.02 64.13 78.57 90.75 143.61 175.95 203.23 38 34.63 70.03 86.05 99.60 158.65 194.94 225.62 39 37.44 76.45 94.20 109.24 175.11 215.78 250.23 40 40.47 83.40 103.05 119.74 193.13 238.62 277.26 41 43.74 90.96 112.68 131.18 212.84 263.67 306.94 42 47.27 99.16 123.16 143.64 234.40 291.13 339.52 43 51.08 108.08 134.56 157.21 257.99 321.22 375.28 44 55.20 117.76 146.97 172.00 283.80 354.20 414.51 45 59.66 128.28 160.48 188.12 312.03 390.35 457.57 Based on data from "Design of Pile Foundations," by A. S. Vesic. Synthesis of Highway Practice by American Association of State Highway and Transportation, 1977 32° 36° 100 30.16 33.60 37.37 41.51 46.05 51.02 56.46 62.41 68.92 76.02 83.78 92.24 101.48 111.56 122.54 134.52 147.59 161.83 177.36 194.31 212.79 34° FIGURE 12.20 Variation of N with L/D (Based on Coyle and Castello, 1981) 38° 40° 200 200 500 57.06 64.62 73.04 82.40 92.80 104.33 117.11 131.24 146.87 164.12 183.16 204.14 227.26 252.71 280.71 311.50 345.34 382.53 423.39 468.28 517.58
Solution
Bartleby Expert
by Bartleby Expert
SEE SOLUTION
Follow-up Question

I need detailed explanation to solve the exercise below. There are some formulas and hints, I also added some tables from the book.
Meyerhof's method, Coyle and Castello's method and Vesic's method were already solved.

TABLE 12.6 Interpolated Values of Ng Based on
Meyerhof's Theory
25
26
27
28
29
Soil friction angle, ø' (deg)
20
21
22
23
24
25
26
27
28
29
30
31
32
33
34
35
36
37
38
10
39
40
41
42
43
20
44
45
TABLE 12.8 Bearing Capacity Factors N. Based on the Theory of Expansion of Cavities
15.95
17.47
19.12
20.91
22.85
24.95
27.22
29.68
32.34
35.21
38.32
41.68
45.31
49.24
53.50
58.10
63.07
68.46
74.30
80.62
87.48
N₂
12.4
13.8
15.5
17.9
21.4
26.0
29.5
34.0
39.7
46.5
56.7
68.2
81.0
96.0
40
115.0
143.0
168.0
194.0
231.0
60
276.0
346.0
420.0
525.0
650.0
780.0
930.0
Embedment ratio, L/D
0
ITT
10
20
30
40
50
60
70
10
T
T
T
Bearing capacity factor, N*
9
20
40 60 80 100
$' = 30°
80
300
400
12.12
20.98
24.64
27.61
39.70
46.61
52.24
13.18
23.15
27.30
30.69
44.53
52.51
59.02
14.33
25.52
30.21
34.06
49.88
59.05
66.56
15.57
28.10
33.40
37.75
55.77
66.29
74.93
16.90
30.90
36.87
41.79
62.27
74.30
84.21
30
18.24
33.95
40.66
46.21
69.43
83.14
94.48
31
19.88
37.27
44.79
51.03
77.31
92.90
105.84
32
21.55
40.88
49.30
56.30
85.96
103.66
118.39
33
23.34
44.80
54.20
62.05
95.46
115.51
132.24
34
25.28
49.05
59.54
68.33
105.90
128.55
147.51
35
27.36
53.67
65.36
75.17
117.33
142.89
164.33
36
29.60
58.68
71.69
82.62
129.87
158.65
182.85
37
32.02
64.13
78.57
90.75
143.61
175.95
203.23
38
34.63
70.03
86.05
99.60
158.65
194.94
225.62
39
37.44
76.45
94.20
109.24
175.11
215.78
250.23
40
40.47
83.40
103.05
119.74
193.13
238.62
277.26
41
43.74
90.96
112.68
131.18
212.84
263.67
306.94
42
47.27
99.16
123.16
143.64
234.40
291.13
339.52
43
51.08
108.08
134.56
157.21
257.99
321.22
375.28
44
55.20
117.76
146.97
172.00
283.80
354.20
414.51
45
59.66
128.28
160.48
188.12
312.03
390.35
457.57
Based on data from "Design of Pile Foundations," by A. S. Vesic. Synthesis of Highway Practice by American Association of State Highway and Transportation, 1977
32° 36°
100
30.16
33.60
37.37
41.51
46.05
51.02
56.46
62.41
68.92
76.02
83.78
92.24
101.48
111.56
122.54
134.52
147.59
161.83
177.36
194.31
212.79
34°
FIGURE 12.20 Variation of N with L/D
(Based on Coyle and Castello, 1981)
38°
40°
200
200
500
57.06
64.62
73.04
82.40
92.80
104.33
117.11
131.24
146.87
164.12
183.16
204.14
227.26
252.71
280.71
311.50
345.34
382.53
423.39
468.28
517.58
expand button
Transcribed Image Text:TABLE 12.6 Interpolated Values of Ng Based on Meyerhof's Theory 25 26 27 28 29 Soil friction angle, ø' (deg) 20 21 22 23 24 25 26 27 28 29 30 31 32 33 34 35 36 37 38 10 39 40 41 42 43 20 44 45 TABLE 12.8 Bearing Capacity Factors N. Based on the Theory of Expansion of Cavities 15.95 17.47 19.12 20.91 22.85 24.95 27.22 29.68 32.34 35.21 38.32 41.68 45.31 49.24 53.50 58.10 63.07 68.46 74.30 80.62 87.48 N₂ 12.4 13.8 15.5 17.9 21.4 26.0 29.5 34.0 39.7 46.5 56.7 68.2 81.0 96.0 40 115.0 143.0 168.0 194.0 231.0 60 276.0 346.0 420.0 525.0 650.0 780.0 930.0 Embedment ratio, L/D 0 ITT 10 20 30 40 50 60 70 10 T T T Bearing capacity factor, N* 9 20 40 60 80 100 $' = 30° 80 300 400 12.12 20.98 24.64 27.61 39.70 46.61 52.24 13.18 23.15 27.30 30.69 44.53 52.51 59.02 14.33 25.52 30.21 34.06 49.88 59.05 66.56 15.57 28.10 33.40 37.75 55.77 66.29 74.93 16.90 30.90 36.87 41.79 62.27 74.30 84.21 30 18.24 33.95 40.66 46.21 69.43 83.14 94.48 31 19.88 37.27 44.79 51.03 77.31 92.90 105.84 32 21.55 40.88 49.30 56.30 85.96 103.66 118.39 33 23.34 44.80 54.20 62.05 95.46 115.51 132.24 34 25.28 49.05 59.54 68.33 105.90 128.55 147.51 35 27.36 53.67 65.36 75.17 117.33 142.89 164.33 36 29.60 58.68 71.69 82.62 129.87 158.65 182.85 37 32.02 64.13 78.57 90.75 143.61 175.95 203.23 38 34.63 70.03 86.05 99.60 158.65 194.94 225.62 39 37.44 76.45 94.20 109.24 175.11 215.78 250.23 40 40.47 83.40 103.05 119.74 193.13 238.62 277.26 41 43.74 90.96 112.68 131.18 212.84 263.67 306.94 42 47.27 99.16 123.16 143.64 234.40 291.13 339.52 43 51.08 108.08 134.56 157.21 257.99 321.22 375.28 44 55.20 117.76 146.97 172.00 283.80 354.20 414.51 45 59.66 128.28 160.48 188.12 312.03 390.35 457.57 Based on data from "Design of Pile Foundations," by A. S. Vesic. Synthesis of Highway Practice by American Association of State Highway and Transportation, 1977 32° 36° 100 30.16 33.60 37.37 41.51 46.05 51.02 56.46 62.41 68.92 76.02 83.78 92.24 101.48 111.56 122.54 134.52 147.59 161.83 177.36 194.31 212.79 34° FIGURE 12.20 Variation of N with L/D (Based on Coyle and Castello, 1981) 38° 40° 200 200 500 57.06 64.62 73.04 82.40 92.80 104.33 117.11 131.24 146.87 164.12 183.16 204.14 227.26 252.71 280.71 311.50 345.34 382.53 423.39 468.28 517.58
A 20 m long concrete pile with a rectangular cross section of 460 mm × 460 mm fully embedded in sand is shown in
Figure P 12.2. Estimate the ultimate point load or tip resistance Qp by each of the following 4 methods and discuss.
Necessary variables and formulae:
Area of the pile tip
Effective vertical stress at the level of the pile tip
Atmospheric pressure 100 kN/m²
Ap
q'
Pa
o'o
Irr
Ir
A
Ms
Mean effective normal ground stress at the level of the pile point
Reduced rigidity index for the soil
Rigidity index for the soil
Average volumetric strain in the plastic zone below the pile point
Poisson's ratio of soil
1) Terzaghi's method (Use Ng
=
2) Meyerhof's method (Use Table 12.6 for interpolation of Na)
Sand: Qp = min (q', 0.5påtanp') · No Ap
3) Vesic's method (Use Table 12.8 for interpolation of N and modulus of elasticity of soil of Es = 600pa)
Sand: Qp = ¯'。No Ap
where ' =
0
exp[(37-4¹) tand
2
1-sin o'
1+2Ko
3
q', K. = 1 - sino', Irr
=
20 m
Ir
1+1,Δ
FIGURE P 12.2
9
Ir
=
For 25° ≤ ø' ≤ 45°, µs = 0.1 +0.3 (25¹), A = 0.005 (1 – $¹_25")
'-25°
q'
{
20°
20° Pa
Es
2(1+μ₂)q'tand'
4) Coyle and Castello's method (Use Figure 12.20 for extrapolation of Na)
Sand: Qp = q'N Ap
Concrete pile
460 mm X 460 mm
Loose sand
φί = 30°
y = 18.6 kN/m³
Dense sand
$'2 = 42°
y = 18.5 kN/m³
expand button
Transcribed Image Text:A 20 m long concrete pile with a rectangular cross section of 460 mm × 460 mm fully embedded in sand is shown in Figure P 12.2. Estimate the ultimate point load or tip resistance Qp by each of the following 4 methods and discuss. Necessary variables and formulae: Area of the pile tip Effective vertical stress at the level of the pile tip Atmospheric pressure 100 kN/m² Ap q' Pa o'o Irr Ir A Ms Mean effective normal ground stress at the level of the pile point Reduced rigidity index for the soil Rigidity index for the soil Average volumetric strain in the plastic zone below the pile point Poisson's ratio of soil 1) Terzaghi's method (Use Ng = 2) Meyerhof's method (Use Table 12.6 for interpolation of Na) Sand: Qp = min (q', 0.5påtanp') · No Ap 3) Vesic's method (Use Table 12.8 for interpolation of N and modulus of elasticity of soil of Es = 600pa) Sand: Qp = ¯'。No Ap where ' = 0 exp[(37-4¹) tand 2 1-sin o' 1+2Ko 3 q', K. = 1 - sino', Irr = 20 m Ir 1+1,Δ FIGURE P 12.2 9 Ir = For 25° ≤ ø' ≤ 45°, µs = 0.1 +0.3 (25¹), A = 0.005 (1 – $¹_25") '-25° q' { 20° 20° Pa Es 2(1+μ₂)q'tand' 4) Coyle and Castello's method (Use Figure 12.20 for extrapolation of Na) Sand: Qp = q'N Ap Concrete pile 460 mm X 460 mm Loose sand φί = 30° y = 18.6 kN/m³ Dense sand $'2 = 42° y = 18.5 kN/m³
Solution
Bartleby Expert
by Bartleby Expert
SEE SOLUTION
Follow-up Question

I need detailed explanation to solve the exercise below. There are some formulas and hints, I also added some tables from the book.
Meyerhof's method, Coyle and Castello's method and Vesic's method were already solved.

A 20 m long concrete pile with a rectangular cross section of 460 mm × 460 mm fully embedded in sand is shown in
Figure P 12.2. Estimate the ultimate point load or tip resistance Qp by each of the following 4 methods and discuss.
Necessary variables and formulae:
Area of the pile tip
Effective vertical stress at the level of the pile tip
Atmospheric pressure 100 kN/m²
Ap
q'
Pa
o'o
Irr
Ir
A
Ms
Mean effective normal ground stress at the level of the pile point
Reduced rigidity index for the soil
Rigidity index for the soil
Average volumetric strain in the plastic zone below the pile point
Poisson's ratio of soil
1) Terzaghi's method (Use Ng
=
2) Meyerhof's method (Use Table 12.6 for interpolation of Na)
Sand: Qp = min (q', 0.5påtanp') · No Ap
3) Vesic's method (Use Table 12.8 for interpolation of N and modulus of elasticity of soil of Es = 600pa)
Sand: Qp = ¯'。No Ap
where ' =
0
exp[(37-4¹) tand
2
1-sin o'
1+2Ko
3
q', K. = 1 - sino', Irr
=
20 m
Ir
1+1,Δ
FIGURE P 12.2
9
Ir
=
For 25° ≤ ø' ≤ 45°, µs = 0.1 +0.3 (25¹), A = 0.005 (1 – $¹_25")
'-25°
q'
{
20°
20° Pa
Es
2(1+μ₂)q'tand'
4) Coyle and Castello's method (Use Figure 12.20 for extrapolation of Na)
Sand: Qp = q'N Ap
Concrete pile
460 mm X 460 mm
Loose sand
φί = 30°
y = 18.6 kN/m³
Dense sand
$'2 = 42°
y = 18.5 kN/m³
expand button
Transcribed Image Text:A 20 m long concrete pile with a rectangular cross section of 460 mm × 460 mm fully embedded in sand is shown in Figure P 12.2. Estimate the ultimate point load or tip resistance Qp by each of the following 4 methods and discuss. Necessary variables and formulae: Area of the pile tip Effective vertical stress at the level of the pile tip Atmospheric pressure 100 kN/m² Ap q' Pa o'o Irr Ir A Ms Mean effective normal ground stress at the level of the pile point Reduced rigidity index for the soil Rigidity index for the soil Average volumetric strain in the plastic zone below the pile point Poisson's ratio of soil 1) Terzaghi's method (Use Ng = 2) Meyerhof's method (Use Table 12.6 for interpolation of Na) Sand: Qp = min (q', 0.5påtanp') · No Ap 3) Vesic's method (Use Table 12.8 for interpolation of N and modulus of elasticity of soil of Es = 600pa) Sand: Qp = ¯'。No Ap where ' = 0 exp[(37-4¹) tand 2 1-sin o' 1+2Ko 3 q', K. = 1 - sino', Irr = 20 m Ir 1+1,Δ FIGURE P 12.2 9 Ir = For 25° ≤ ø' ≤ 45°, µs = 0.1 +0.3 (25¹), A = 0.005 (1 – $¹_25") '-25° q' { 20° 20° Pa Es 2(1+μ₂)q'tand' 4) Coyle and Castello's method (Use Figure 12.20 for extrapolation of Na) Sand: Qp = q'N Ap Concrete pile 460 mm X 460 mm Loose sand φί = 30° y = 18.6 kN/m³ Dense sand $'2 = 42° y = 18.5 kN/m³
TABLE 12.6 Interpolated Values of Ng Based on
Meyerhof's Theory
25
26
27
28
29
Soil friction angle, ø' (deg)
20
21
22
23
24
25
26
27
28
29
30
31
32
33
34
35
36
37
38
10
39
40
41
42
43
20
44
45
TABLE 12.8 Bearing Capacity Factors N. Based on the Theory of Expansion of Cavities
15.95
17.47
19.12
20.91
22.85
24.95
27.22
29.68
32.34
35.21
38.32
41.68
45.31
49.24
53.50
58.10
63.07
68.46
74.30
80.62
87.48
N₂
12.4
13.8
15.5
17.9
21.4
26.0
29.5
34.0
39.7
46.5
56.7
68.2
81.0
96.0
40
115.0
143.0
168.0
194.0
231.0
60
276.0
346.0
420.0
525.0
650.0
780.0
930.0
Embedment ratio, L/D
0
ITT
10
20
30
40
50
60
70
10
T
T
T
Bearing capacity factor, N*
9
20
40 60 80 100
$' = 30°
80
300
400
12.12
20.98
24.64
27.61
39.70
46.61
52.24
13.18
23.15
27.30
30.69
44.53
52.51
59.02
14.33
25.52
30.21
34.06
49.88
59.05
66.56
15.57
28.10
33.40
37.75
55.77
66.29
74.93
16.90
30.90
36.87
41.79
62.27
74.30
84.21
30
18.24
33.95
40.66
46.21
69.43
83.14
94.48
31
19.88
37.27
44.79
51.03
77.31
92.90
105.84
32
21.55
40.88
49.30
56.30
85.96
103.66
118.39
33
23.34
44.80
54.20
62.05
95.46
115.51
132.24
34
25.28
49.05
59.54
68.33
105.90
128.55
147.51
35
27.36
53.67
65.36
75.17
117.33
142.89
164.33
36
29.60
58.68
71.69
82.62
129.87
158.65
182.85
37
32.02
64.13
78.57
90.75
143.61
175.95
203.23
38
34.63
70.03
86.05
99.60
158.65
194.94
225.62
39
37.44
76.45
94.20
109.24
175.11
215.78
250.23
40
40.47
83.40
103.05
119.74
193.13
238.62
277.26
41
43.74
90.96
112.68
131.18
212.84
263.67
306.94
42
47.27
99.16
123.16
143.64
234.40
291.13
339.52
43
51.08
108.08
134.56
157.21
257.99
321.22
375.28
44
55.20
117.76
146.97
172.00
283.80
354.20
414.51
45
59.66
128.28
160.48
188.12
312.03
390.35
457.57
Based on data from "Design of Pile Foundations," by A. S. Vesic. Synthesis of Highway Practice by American Association of State Highway and Transportation, 1977
32° 36°
100
30.16
33.60
37.37
41.51
46.05
51.02
56.46
62.41
68.92
76.02
83.78
92.24
101.48
111.56
122.54
134.52
147.59
161.83
177.36
194.31
212.79
34°
FIGURE 12.20 Variation of N with L/D
(Based on Coyle and Castello, 1981)
38°
40°
200
200
500
57.06
64.62
73.04
82.40
92.80
104.33
117.11
131.24
146.87
164.12
183.16
204.14
227.26
252.71
280.71
311.50
345.34
382.53
423.39
468.28
517.58
expand button
Transcribed Image Text:TABLE 12.6 Interpolated Values of Ng Based on Meyerhof's Theory 25 26 27 28 29 Soil friction angle, ø' (deg) 20 21 22 23 24 25 26 27 28 29 30 31 32 33 34 35 36 37 38 10 39 40 41 42 43 20 44 45 TABLE 12.8 Bearing Capacity Factors N. Based on the Theory of Expansion of Cavities 15.95 17.47 19.12 20.91 22.85 24.95 27.22 29.68 32.34 35.21 38.32 41.68 45.31 49.24 53.50 58.10 63.07 68.46 74.30 80.62 87.48 N₂ 12.4 13.8 15.5 17.9 21.4 26.0 29.5 34.0 39.7 46.5 56.7 68.2 81.0 96.0 40 115.0 143.0 168.0 194.0 231.0 60 276.0 346.0 420.0 525.0 650.0 780.0 930.0 Embedment ratio, L/D 0 ITT 10 20 30 40 50 60 70 10 T T T Bearing capacity factor, N* 9 20 40 60 80 100 $' = 30° 80 300 400 12.12 20.98 24.64 27.61 39.70 46.61 52.24 13.18 23.15 27.30 30.69 44.53 52.51 59.02 14.33 25.52 30.21 34.06 49.88 59.05 66.56 15.57 28.10 33.40 37.75 55.77 66.29 74.93 16.90 30.90 36.87 41.79 62.27 74.30 84.21 30 18.24 33.95 40.66 46.21 69.43 83.14 94.48 31 19.88 37.27 44.79 51.03 77.31 92.90 105.84 32 21.55 40.88 49.30 56.30 85.96 103.66 118.39 33 23.34 44.80 54.20 62.05 95.46 115.51 132.24 34 25.28 49.05 59.54 68.33 105.90 128.55 147.51 35 27.36 53.67 65.36 75.17 117.33 142.89 164.33 36 29.60 58.68 71.69 82.62 129.87 158.65 182.85 37 32.02 64.13 78.57 90.75 143.61 175.95 203.23 38 34.63 70.03 86.05 99.60 158.65 194.94 225.62 39 37.44 76.45 94.20 109.24 175.11 215.78 250.23 40 40.47 83.40 103.05 119.74 193.13 238.62 277.26 41 43.74 90.96 112.68 131.18 212.84 263.67 306.94 42 47.27 99.16 123.16 143.64 234.40 291.13 339.52 43 51.08 108.08 134.56 157.21 257.99 321.22 375.28 44 55.20 117.76 146.97 172.00 283.80 354.20 414.51 45 59.66 128.28 160.48 188.12 312.03 390.35 457.57 Based on data from "Design of Pile Foundations," by A. S. Vesic. Synthesis of Highway Practice by American Association of State Highway and Transportation, 1977 32° 36° 100 30.16 33.60 37.37 41.51 46.05 51.02 56.46 62.41 68.92 76.02 83.78 92.24 101.48 111.56 122.54 134.52 147.59 161.83 177.36 194.31 212.79 34° FIGURE 12.20 Variation of N with L/D (Based on Coyle and Castello, 1981) 38° 40° 200 200 500 57.06 64.62 73.04 82.40 92.80 104.33 117.11 131.24 146.87 164.12 183.16 204.14 227.26 252.71 280.71 311.50 345.34 382.53 423.39 468.28 517.58
Solution
Bartleby Expert
by Bartleby Expert
SEE SOLUTION
Follow-up Question

I need detailed explanation to solve the exercise below. There are some formulas and hints, I also added some tables from the book.
Meyerhof's method, Coyle and Castello's method and Vesic's method were already solved.

TABLE 12.6 Interpolated Values of Ng Based on
Meyerhof's Theory
25
26
27
28
29
Soil friction angle, ø' (deg)
20
21
22
23
24
25
26
27
28
29
30
31
32
33
34
35
36
37
38
10
39
40
41
42
43
20
44
45
TABLE 12.8 Bearing Capacity Factors N. Based on the Theory of Expansion of Cavities
15.95
17.47
19.12
20.91
22.85
24.95
27.22
29.68
32.34
35.21
38.32
41.68
45.31
49.24
53.50
58.10
63.07
68.46
74.30
80.62
87.48
N₂
12.4
13.8
15.5
17.9
21.4
26.0
29.5
34.0
39.7
46.5
56.7
68.2
81.0
96.0
40
115.0
143.0
168.0
194.0
231.0
60
276.0
346.0
420.0
525.0
650.0
780.0
930.0
Embedment ratio, L/D
0
ITT
10
20
30
40
50
60
70
10
T
T
T
Bearing capacity factor, N*
9
20
40 60 80 100
$' = 30°
80
300
400
12.12
20.98
24.64
27.61
39.70
46.61
52.24
13.18
23.15
27.30
30.69
44.53
52.51
59.02
14.33
25.52
30.21
34.06
49.88
59.05
66.56
15.57
28.10
33.40
37.75
55.77
66.29
74.93
16.90
30.90
36.87
41.79
62.27
74.30
84.21
30
18.24
33.95
40.66
46.21
69.43
83.14
94.48
31
19.88
37.27
44.79
51.03
77.31
92.90
105.84
32
21.55
40.88
49.30
56.30
85.96
103.66
118.39
33
23.34
44.80
54.20
62.05
95.46
115.51
132.24
34
25.28
49.05
59.54
68.33
105.90
128.55
147.51
35
27.36
53.67
65.36
75.17
117.33
142.89
164.33
36
29.60
58.68
71.69
82.62
129.87
158.65
182.85
37
32.02
64.13
78.57
90.75
143.61
175.95
203.23
38
34.63
70.03
86.05
99.60
158.65
194.94
225.62
39
37.44
76.45
94.20
109.24
175.11
215.78
250.23
40
40.47
83.40
103.05
119.74
193.13
238.62
277.26
41
43.74
90.96
112.68
131.18
212.84
263.67
306.94
42
47.27
99.16
123.16
143.64
234.40
291.13
339.52
43
51.08
108.08
134.56
157.21
257.99
321.22
375.28
44
55.20
117.76
146.97
172.00
283.80
354.20
414.51
45
59.66
128.28
160.48
188.12
312.03
390.35
457.57
Based on data from "Design of Pile Foundations," by A. S. Vesic. Synthesis of Highway Practice by American Association of State Highway and Transportation, 1977
32° 36°
100
30.16
33.60
37.37
41.51
46.05
51.02
56.46
62.41
68.92
76.02
83.78
92.24
101.48
111.56
122.54
134.52
147.59
161.83
177.36
194.31
212.79
34°
FIGURE 12.20 Variation of N with L/D
(Based on Coyle and Castello, 1981)
38°
40°
200
200
500
57.06
64.62
73.04
82.40
92.80
104.33
117.11
131.24
146.87
164.12
183.16
204.14
227.26
252.71
280.71
311.50
345.34
382.53
423.39
468.28
517.58
expand button
Transcribed Image Text:TABLE 12.6 Interpolated Values of Ng Based on Meyerhof's Theory 25 26 27 28 29 Soil friction angle, ø' (deg) 20 21 22 23 24 25 26 27 28 29 30 31 32 33 34 35 36 37 38 10 39 40 41 42 43 20 44 45 TABLE 12.8 Bearing Capacity Factors N. Based on the Theory of Expansion of Cavities 15.95 17.47 19.12 20.91 22.85 24.95 27.22 29.68 32.34 35.21 38.32 41.68 45.31 49.24 53.50 58.10 63.07 68.46 74.30 80.62 87.48 N₂ 12.4 13.8 15.5 17.9 21.4 26.0 29.5 34.0 39.7 46.5 56.7 68.2 81.0 96.0 40 115.0 143.0 168.0 194.0 231.0 60 276.0 346.0 420.0 525.0 650.0 780.0 930.0 Embedment ratio, L/D 0 ITT 10 20 30 40 50 60 70 10 T T T Bearing capacity factor, N* 9 20 40 60 80 100 $' = 30° 80 300 400 12.12 20.98 24.64 27.61 39.70 46.61 52.24 13.18 23.15 27.30 30.69 44.53 52.51 59.02 14.33 25.52 30.21 34.06 49.88 59.05 66.56 15.57 28.10 33.40 37.75 55.77 66.29 74.93 16.90 30.90 36.87 41.79 62.27 74.30 84.21 30 18.24 33.95 40.66 46.21 69.43 83.14 94.48 31 19.88 37.27 44.79 51.03 77.31 92.90 105.84 32 21.55 40.88 49.30 56.30 85.96 103.66 118.39 33 23.34 44.80 54.20 62.05 95.46 115.51 132.24 34 25.28 49.05 59.54 68.33 105.90 128.55 147.51 35 27.36 53.67 65.36 75.17 117.33 142.89 164.33 36 29.60 58.68 71.69 82.62 129.87 158.65 182.85 37 32.02 64.13 78.57 90.75 143.61 175.95 203.23 38 34.63 70.03 86.05 99.60 158.65 194.94 225.62 39 37.44 76.45 94.20 109.24 175.11 215.78 250.23 40 40.47 83.40 103.05 119.74 193.13 238.62 277.26 41 43.74 90.96 112.68 131.18 212.84 263.67 306.94 42 47.27 99.16 123.16 143.64 234.40 291.13 339.52 43 51.08 108.08 134.56 157.21 257.99 321.22 375.28 44 55.20 117.76 146.97 172.00 283.80 354.20 414.51 45 59.66 128.28 160.48 188.12 312.03 390.35 457.57 Based on data from "Design of Pile Foundations," by A. S. Vesic. Synthesis of Highway Practice by American Association of State Highway and Transportation, 1977 32° 36° 100 30.16 33.60 37.37 41.51 46.05 51.02 56.46 62.41 68.92 76.02 83.78 92.24 101.48 111.56 122.54 134.52 147.59 161.83 177.36 194.31 212.79 34° FIGURE 12.20 Variation of N with L/D (Based on Coyle and Castello, 1981) 38° 40° 200 200 500 57.06 64.62 73.04 82.40 92.80 104.33 117.11 131.24 146.87 164.12 183.16 204.14 227.26 252.71 280.71 311.50 345.34 382.53 423.39 468.28 517.58
A 20 m long concrete pile with a rectangular cross section of 460 mm × 460 mm fully embedded in sand is shown in
Figure P 12.2. Estimate the ultimate point load or tip resistance Qp by each of the following 4 methods and discuss.
Necessary variables and formulae:
Area of the pile tip
Effective vertical stress at the level of the pile tip
Atmospheric pressure 100 kN/m²
Ap
q'
Pa
o'o
Irr
Ir
A
Ms
Mean effective normal ground stress at the level of the pile point
Reduced rigidity index for the soil
Rigidity index for the soil
Average volumetric strain in the plastic zone below the pile point
Poisson's ratio of soil
1) Terzaghi's method (Use Ng
=
2) Meyerhof's method (Use Table 12.6 for interpolation of Na)
Sand: Qp = min (q', 0.5påtanp') · No Ap
3) Vesic's method (Use Table 12.8 for interpolation of N and modulus of elasticity of soil of Es = 600pa)
Sand: Qp = ¯'。No Ap
where ' =
0
exp[(37-4¹) tand
2
1-sin o'
1+2Ko
3
q', K. = 1 - sino', Irr
=
20 m
Ir
1+1,Δ
FIGURE P 12.2
9
Ir
=
For 25° ≤ ø' ≤ 45°, µs = 0.1 +0.3 (25¹), A = 0.005 (1 – $¹_25")
'-25°
q'
{
20°
20° Pa
Es
2(1+μ₂)q'tand'
4) Coyle and Castello's method (Use Figure 12.20 for extrapolation of Na)
Sand: Qp = q'N Ap
Concrete pile
460 mm X 460 mm
Loose sand
φί = 30°
y = 18.6 kN/m³
Dense sand
$'2 = 42°
y = 18.5 kN/m³
expand button
Transcribed Image Text:A 20 m long concrete pile with a rectangular cross section of 460 mm × 460 mm fully embedded in sand is shown in Figure P 12.2. Estimate the ultimate point load or tip resistance Qp by each of the following 4 methods and discuss. Necessary variables and formulae: Area of the pile tip Effective vertical stress at the level of the pile tip Atmospheric pressure 100 kN/m² Ap q' Pa o'o Irr Ir A Ms Mean effective normal ground stress at the level of the pile point Reduced rigidity index for the soil Rigidity index for the soil Average volumetric strain in the plastic zone below the pile point Poisson's ratio of soil 1) Terzaghi's method (Use Ng = 2) Meyerhof's method (Use Table 12.6 for interpolation of Na) Sand: Qp = min (q', 0.5påtanp') · No Ap 3) Vesic's method (Use Table 12.8 for interpolation of N and modulus of elasticity of soil of Es = 600pa) Sand: Qp = ¯'。No Ap where ' = 0 exp[(37-4¹) tand 2 1-sin o' 1+2Ko 3 q', K. = 1 - sino', Irr = 20 m Ir 1+1,Δ FIGURE P 12.2 9 Ir = For 25° ≤ ø' ≤ 45°, µs = 0.1 +0.3 (25¹), A = 0.005 (1 – $¹_25") '-25° q' { 20° 20° Pa Es 2(1+μ₂)q'tand' 4) Coyle and Castello's method (Use Figure 12.20 for extrapolation of Na) Sand: Qp = q'N Ap Concrete pile 460 mm X 460 mm Loose sand φί = 30° y = 18.6 kN/m³ Dense sand $'2 = 42° y = 18.5 kN/m³
Solution
Bartleby Expert
by Bartleby Expert
SEE SOLUTION
Follow-up Question

I need detailed explanation to solve the exercise below. There are some formulas and hints, I also added some tables from the book.
Meyerhof's method, Coyle and Castello's method and Vesic's method were already solved.

A 20 m long concrete pile with a rectangular cross section of 460 mm × 460 mm fully embedded in sand is shown in
Figure P 12.2. Estimate the ultimate point load or tip resistance Qp by each of the following 4 methods and discuss.
Necessary variables and formulae:
Area of the pile tip
Effective vertical stress at the level of the pile tip
Atmospheric pressure 100 kN/m²
Ap
q'
Pa
o'o
Irr
Ir
A
Ms
Mean effective normal ground stress at the level of the pile point
Reduced rigidity index for the soil
Rigidity index for the soil
Average volumetric strain in the plastic zone below the pile point
Poisson's ratio of soil
1) Terzaghi's method (Use Ng
=
2) Meyerhof's method (Use Table 12.6 for interpolation of Na)
Sand: Qp = min (q', 0.5påtanp') · No Ap
3) Vesic's method (Use Table 12.8 for interpolation of N and modulus of elasticity of soil of Es = 600pa)
Sand: Qp = ¯'。No Ap
where ' =
0
exp[(37-4¹) tand
2
1-sin o'
1+2Ko
3
q', K. = 1 - sino', Irr
=
20 m
Ir
1+1,Δ
FIGURE P 12.2
9
Ir
=
For 25° ≤ ø' ≤ 45°, µs = 0.1 +0.3 (25¹), A = 0.005 (1 – $¹_25")
'-25°
q'
{
20°
20° Pa
Es
2(1+μ₂)q'tand'
4) Coyle and Castello's method (Use Figure 12.20 for extrapolation of Na)
Sand: Qp = q'N Ap
Concrete pile
460 mm X 460 mm
Loose sand
φί = 30°
y = 18.6 kN/m³
Dense sand
$'2 = 42°
y = 18.5 kN/m³
expand button
Transcribed Image Text:A 20 m long concrete pile with a rectangular cross section of 460 mm × 460 mm fully embedded in sand is shown in Figure P 12.2. Estimate the ultimate point load or tip resistance Qp by each of the following 4 methods and discuss. Necessary variables and formulae: Area of the pile tip Effective vertical stress at the level of the pile tip Atmospheric pressure 100 kN/m² Ap q' Pa o'o Irr Ir A Ms Mean effective normal ground stress at the level of the pile point Reduced rigidity index for the soil Rigidity index for the soil Average volumetric strain in the plastic zone below the pile point Poisson's ratio of soil 1) Terzaghi's method (Use Ng = 2) Meyerhof's method (Use Table 12.6 for interpolation of Na) Sand: Qp = min (q', 0.5påtanp') · No Ap 3) Vesic's method (Use Table 12.8 for interpolation of N and modulus of elasticity of soil of Es = 600pa) Sand: Qp = ¯'。No Ap where ' = 0 exp[(37-4¹) tand 2 1-sin o' 1+2Ko 3 q', K. = 1 - sino', Irr = 20 m Ir 1+1,Δ FIGURE P 12.2 9 Ir = For 25° ≤ ø' ≤ 45°, µs = 0.1 +0.3 (25¹), A = 0.005 (1 – $¹_25") '-25° q' { 20° 20° Pa Es 2(1+μ₂)q'tand' 4) Coyle and Castello's method (Use Figure 12.20 for extrapolation of Na) Sand: Qp = q'N Ap Concrete pile 460 mm X 460 mm Loose sand φί = 30° y = 18.6 kN/m³ Dense sand $'2 = 42° y = 18.5 kN/m³
TABLE 12.6 Interpolated Values of Ng Based on
Meyerhof's Theory
25
26
27
28
29
Soil friction angle, ø' (deg)
20
21
22
23
24
25
26
27
28
29
30
31
32
33
34
35
36
37
38
10
39
40
41
42
43
20
44
45
TABLE 12.8 Bearing Capacity Factors N. Based on the Theory of Expansion of Cavities
15.95
17.47
19.12
20.91
22.85
24.95
27.22
29.68
32.34
35.21
38.32
41.68
45.31
49.24
53.50
58.10
63.07
68.46
74.30
80.62
87.48
N₂
12.4
13.8
15.5
17.9
21.4
26.0
29.5
34.0
39.7
46.5
56.7
68.2
81.0
96.0
40
115.0
143.0
168.0
194.0
231.0
60
276.0
346.0
420.0
525.0
650.0
780.0
930.0
Embedment ratio, L/D
0
ITT
10
20
30
40
50
60
70
10
T
T
T
Bearing capacity factor, N*
9
20
40 60 80 100
$' = 30°
80
300
400
12.12
20.98
24.64
27.61
39.70
46.61
52.24
13.18
23.15
27.30
30.69
44.53
52.51
59.02
14.33
25.52
30.21
34.06
49.88
59.05
66.56
15.57
28.10
33.40
37.75
55.77
66.29
74.93
16.90
30.90
36.87
41.79
62.27
74.30
84.21
30
18.24
33.95
40.66
46.21
69.43
83.14
94.48
31
19.88
37.27
44.79
51.03
77.31
92.90
105.84
32
21.55
40.88
49.30
56.30
85.96
103.66
118.39
33
23.34
44.80
54.20
62.05
95.46
115.51
132.24
34
25.28
49.05
59.54
68.33
105.90
128.55
147.51
35
27.36
53.67
65.36
75.17
117.33
142.89
164.33
36
29.60
58.68
71.69
82.62
129.87
158.65
182.85
37
32.02
64.13
78.57
90.75
143.61
175.95
203.23
38
34.63
70.03
86.05
99.60
158.65
194.94
225.62
39
37.44
76.45
94.20
109.24
175.11
215.78
250.23
40
40.47
83.40
103.05
119.74
193.13
238.62
277.26
41
43.74
90.96
112.68
131.18
212.84
263.67
306.94
42
47.27
99.16
123.16
143.64
234.40
291.13
339.52
43
51.08
108.08
134.56
157.21
257.99
321.22
375.28
44
55.20
117.76
146.97
172.00
283.80
354.20
414.51
45
59.66
128.28
160.48
188.12
312.03
390.35
457.57
Based on data from "Design of Pile Foundations," by A. S. Vesic. Synthesis of Highway Practice by American Association of State Highway and Transportation, 1977
32° 36°
100
30.16
33.60
37.37
41.51
46.05
51.02
56.46
62.41
68.92
76.02
83.78
92.24
101.48
111.56
122.54
134.52
147.59
161.83
177.36
194.31
212.79
34°
FIGURE 12.20 Variation of N with L/D
(Based on Coyle and Castello, 1981)
38°
40°
200
200
500
57.06
64.62
73.04
82.40
92.80
104.33
117.11
131.24
146.87
164.12
183.16
204.14
227.26
252.71
280.71
311.50
345.34
382.53
423.39
468.28
517.58
expand button
Transcribed Image Text:TABLE 12.6 Interpolated Values of Ng Based on Meyerhof's Theory 25 26 27 28 29 Soil friction angle, ø' (deg) 20 21 22 23 24 25 26 27 28 29 30 31 32 33 34 35 36 37 38 10 39 40 41 42 43 20 44 45 TABLE 12.8 Bearing Capacity Factors N. Based on the Theory of Expansion of Cavities 15.95 17.47 19.12 20.91 22.85 24.95 27.22 29.68 32.34 35.21 38.32 41.68 45.31 49.24 53.50 58.10 63.07 68.46 74.30 80.62 87.48 N₂ 12.4 13.8 15.5 17.9 21.4 26.0 29.5 34.0 39.7 46.5 56.7 68.2 81.0 96.0 40 115.0 143.0 168.0 194.0 231.0 60 276.0 346.0 420.0 525.0 650.0 780.0 930.0 Embedment ratio, L/D 0 ITT 10 20 30 40 50 60 70 10 T T T Bearing capacity factor, N* 9 20 40 60 80 100 $' = 30° 80 300 400 12.12 20.98 24.64 27.61 39.70 46.61 52.24 13.18 23.15 27.30 30.69 44.53 52.51 59.02 14.33 25.52 30.21 34.06 49.88 59.05 66.56 15.57 28.10 33.40 37.75 55.77 66.29 74.93 16.90 30.90 36.87 41.79 62.27 74.30 84.21 30 18.24 33.95 40.66 46.21 69.43 83.14 94.48 31 19.88 37.27 44.79 51.03 77.31 92.90 105.84 32 21.55 40.88 49.30 56.30 85.96 103.66 118.39 33 23.34 44.80 54.20 62.05 95.46 115.51 132.24 34 25.28 49.05 59.54 68.33 105.90 128.55 147.51 35 27.36 53.67 65.36 75.17 117.33 142.89 164.33 36 29.60 58.68 71.69 82.62 129.87 158.65 182.85 37 32.02 64.13 78.57 90.75 143.61 175.95 203.23 38 34.63 70.03 86.05 99.60 158.65 194.94 225.62 39 37.44 76.45 94.20 109.24 175.11 215.78 250.23 40 40.47 83.40 103.05 119.74 193.13 238.62 277.26 41 43.74 90.96 112.68 131.18 212.84 263.67 306.94 42 47.27 99.16 123.16 143.64 234.40 291.13 339.52 43 51.08 108.08 134.56 157.21 257.99 321.22 375.28 44 55.20 117.76 146.97 172.00 283.80 354.20 414.51 45 59.66 128.28 160.48 188.12 312.03 390.35 457.57 Based on data from "Design of Pile Foundations," by A. S. Vesic. Synthesis of Highway Practice by American Association of State Highway and Transportation, 1977 32° 36° 100 30.16 33.60 37.37 41.51 46.05 51.02 56.46 62.41 68.92 76.02 83.78 92.24 101.48 111.56 122.54 134.52 147.59 161.83 177.36 194.31 212.79 34° FIGURE 12.20 Variation of N with L/D (Based on Coyle and Castello, 1981) 38° 40° 200 200 500 57.06 64.62 73.04 82.40 92.80 104.33 117.11 131.24 146.87 164.12 183.16 204.14 227.26 252.71 280.71 311.50 345.34 382.53 423.39 468.28 517.58
Solution
Bartleby Expert
by Bartleby Expert
SEE SOLUTION
Follow-up Question

I need detailed explanation to solve the exercise below. There are some formulas and hints, I also added some tables from the book.
Meyerhof's method, Coyle and Castello's method and Vesic's method were already solved.

TABLE 12.6 Interpolated Values of Ng Based on
Meyerhof's Theory
25
26
27
28
29
Soil friction angle, ø' (deg)
20
21
22
23
24
25
26
27
28
29
30
31
32
33
34
35
36
37
38
10
39
40
41
42
43
20
44
45
TABLE 12.8 Bearing Capacity Factors N. Based on the Theory of Expansion of Cavities
15.95
17.47
19.12
20.91
22.85
24.95
27.22
29.68
32.34
35.21
38.32
41.68
45.31
49.24
53.50
58.10
63.07
68.46
74.30
80.62
87.48
N₂
12.4
13.8
15.5
17.9
21.4
26.0
29.5
34.0
39.7
46.5
56.7
68.2
81.0
96.0
40
115.0
143.0
168.0
194.0
231.0
60
276.0
346.0
420.0
525.0
650.0
780.0
930.0
Embedment ratio, L/D
0
ITT
10
20
30
40
50
60
70
10
T
T
T
Bearing capacity factor, N*
9
20
40 60 80 100
$' = 30°
80
300
400
12.12
20.98
24.64
27.61
39.70
46.61
52.24
13.18
23.15
27.30
30.69
44.53
52.51
59.02
14.33
25.52
30.21
34.06
49.88
59.05
66.56
15.57
28.10
33.40
37.75
55.77
66.29
74.93
16.90
30.90
36.87
41.79
62.27
74.30
84.21
30
18.24
33.95
40.66
46.21
69.43
83.14
94.48
31
19.88
37.27
44.79
51.03
77.31
92.90
105.84
32
21.55
40.88
49.30
56.30
85.96
103.66
118.39
33
23.34
44.80
54.20
62.05
95.46
115.51
132.24
34
25.28
49.05
59.54
68.33
105.90
128.55
147.51
35
27.36
53.67
65.36
75.17
117.33
142.89
164.33
36
29.60
58.68
71.69
82.62
129.87
158.65
182.85
37
32.02
64.13
78.57
90.75
143.61
175.95
203.23
38
34.63
70.03
86.05
99.60
158.65
194.94
225.62
39
37.44
76.45
94.20
109.24
175.11
215.78
250.23
40
40.47
83.40
103.05
119.74
193.13
238.62
277.26
41
43.74
90.96
112.68
131.18
212.84
263.67
306.94
42
47.27
99.16
123.16
143.64
234.40
291.13
339.52
43
51.08
108.08
134.56
157.21
257.99
321.22
375.28
44
55.20
117.76
146.97
172.00
283.80
354.20
414.51
45
59.66
128.28
160.48
188.12
312.03
390.35
457.57
Based on data from "Design of Pile Foundations," by A. S. Vesic. Synthesis of Highway Practice by American Association of State Highway and Transportation, 1977
32° 36°
100
30.16
33.60
37.37
41.51
46.05
51.02
56.46
62.41
68.92
76.02
83.78
92.24
101.48
111.56
122.54
134.52
147.59
161.83
177.36
194.31
212.79
34°
FIGURE 12.20 Variation of N with L/D
(Based on Coyle and Castello, 1981)
38°
40°
200
200
500
57.06
64.62
73.04
82.40
92.80
104.33
117.11
131.24
146.87
164.12
183.16
204.14
227.26
252.71
280.71
311.50
345.34
382.53
423.39
468.28
517.58
expand button
Transcribed Image Text:TABLE 12.6 Interpolated Values of Ng Based on Meyerhof's Theory 25 26 27 28 29 Soil friction angle, ø' (deg) 20 21 22 23 24 25 26 27 28 29 30 31 32 33 34 35 36 37 38 10 39 40 41 42 43 20 44 45 TABLE 12.8 Bearing Capacity Factors N. Based on the Theory of Expansion of Cavities 15.95 17.47 19.12 20.91 22.85 24.95 27.22 29.68 32.34 35.21 38.32 41.68 45.31 49.24 53.50 58.10 63.07 68.46 74.30 80.62 87.48 N₂ 12.4 13.8 15.5 17.9 21.4 26.0 29.5 34.0 39.7 46.5 56.7 68.2 81.0 96.0 40 115.0 143.0 168.0 194.0 231.0 60 276.0 346.0 420.0 525.0 650.0 780.0 930.0 Embedment ratio, L/D 0 ITT 10 20 30 40 50 60 70 10 T T T Bearing capacity factor, N* 9 20 40 60 80 100 $' = 30° 80 300 400 12.12 20.98 24.64 27.61 39.70 46.61 52.24 13.18 23.15 27.30 30.69 44.53 52.51 59.02 14.33 25.52 30.21 34.06 49.88 59.05 66.56 15.57 28.10 33.40 37.75 55.77 66.29 74.93 16.90 30.90 36.87 41.79 62.27 74.30 84.21 30 18.24 33.95 40.66 46.21 69.43 83.14 94.48 31 19.88 37.27 44.79 51.03 77.31 92.90 105.84 32 21.55 40.88 49.30 56.30 85.96 103.66 118.39 33 23.34 44.80 54.20 62.05 95.46 115.51 132.24 34 25.28 49.05 59.54 68.33 105.90 128.55 147.51 35 27.36 53.67 65.36 75.17 117.33 142.89 164.33 36 29.60 58.68 71.69 82.62 129.87 158.65 182.85 37 32.02 64.13 78.57 90.75 143.61 175.95 203.23 38 34.63 70.03 86.05 99.60 158.65 194.94 225.62 39 37.44 76.45 94.20 109.24 175.11 215.78 250.23 40 40.47 83.40 103.05 119.74 193.13 238.62 277.26 41 43.74 90.96 112.68 131.18 212.84 263.67 306.94 42 47.27 99.16 123.16 143.64 234.40 291.13 339.52 43 51.08 108.08 134.56 157.21 257.99 321.22 375.28 44 55.20 117.76 146.97 172.00 283.80 354.20 414.51 45 59.66 128.28 160.48 188.12 312.03 390.35 457.57 Based on data from "Design of Pile Foundations," by A. S. Vesic. Synthesis of Highway Practice by American Association of State Highway and Transportation, 1977 32° 36° 100 30.16 33.60 37.37 41.51 46.05 51.02 56.46 62.41 68.92 76.02 83.78 92.24 101.48 111.56 122.54 134.52 147.59 161.83 177.36 194.31 212.79 34° FIGURE 12.20 Variation of N with L/D (Based on Coyle and Castello, 1981) 38° 40° 200 200 500 57.06 64.62 73.04 82.40 92.80 104.33 117.11 131.24 146.87 164.12 183.16 204.14 227.26 252.71 280.71 311.50 345.34 382.53 423.39 468.28 517.58
A 20 m long concrete pile with a rectangular cross section of 460 mm × 460 mm fully embedded in sand is shown in
Figure P 12.2. Estimate the ultimate point load or tip resistance Qp by each of the following 4 methods and discuss.
Necessary variables and formulae:
Area of the pile tip
Effective vertical stress at the level of the pile tip
Atmospheric pressure 100 kN/m²
Ap
q'
Pa
o'o
Irr
Ir
A
Ms
Mean effective normal ground stress at the level of the pile point
Reduced rigidity index for the soil
Rigidity index for the soil
Average volumetric strain in the plastic zone below the pile point
Poisson's ratio of soil
1) Terzaghi's method (Use Ng
=
2) Meyerhof's method (Use Table 12.6 for interpolation of Na)
Sand: Qp = min (q', 0.5påtanp') · No Ap
3) Vesic's method (Use Table 12.8 for interpolation of N and modulus of elasticity of soil of Es = 600pa)
Sand: Qp = ¯'。No Ap
where ' =
0
exp[(37-4¹) tand
2
1-sin o'
1+2Ko
3
q', K. = 1 - sino', Irr
=
20 m
Ir
1+1,Δ
FIGURE P 12.2
9
Ir
=
For 25° ≤ ø' ≤ 45°, µs = 0.1 +0.3 (25¹), A = 0.005 (1 – $¹_25")
'-25°
q'
{
20°
20° Pa
Es
2(1+μ₂)q'tand'
4) Coyle and Castello's method (Use Figure 12.20 for extrapolation of Na)
Sand: Qp = q'N Ap
Concrete pile
460 mm X 460 mm
Loose sand
φί = 30°
y = 18.6 kN/m³
Dense sand
$'2 = 42°
y = 18.5 kN/m³
expand button
Transcribed Image Text:A 20 m long concrete pile with a rectangular cross section of 460 mm × 460 mm fully embedded in sand is shown in Figure P 12.2. Estimate the ultimate point load or tip resistance Qp by each of the following 4 methods and discuss. Necessary variables and formulae: Area of the pile tip Effective vertical stress at the level of the pile tip Atmospheric pressure 100 kN/m² Ap q' Pa o'o Irr Ir A Ms Mean effective normal ground stress at the level of the pile point Reduced rigidity index for the soil Rigidity index for the soil Average volumetric strain in the plastic zone below the pile point Poisson's ratio of soil 1) Terzaghi's method (Use Ng = 2) Meyerhof's method (Use Table 12.6 for interpolation of Na) Sand: Qp = min (q', 0.5påtanp') · No Ap 3) Vesic's method (Use Table 12.8 for interpolation of N and modulus of elasticity of soil of Es = 600pa) Sand: Qp = ¯'。No Ap where ' = 0 exp[(37-4¹) tand 2 1-sin o' 1+2Ko 3 q', K. = 1 - sino', Irr = 20 m Ir 1+1,Δ FIGURE P 12.2 9 Ir = For 25° ≤ ø' ≤ 45°, µs = 0.1 +0.3 (25¹), A = 0.005 (1 – $¹_25") '-25° q' { 20° 20° Pa Es 2(1+μ₂)q'tand' 4) Coyle and Castello's method (Use Figure 12.20 for extrapolation of Na) Sand: Qp = q'N Ap Concrete pile 460 mm X 460 mm Loose sand φί = 30° y = 18.6 kN/m³ Dense sand $'2 = 42° y = 18.5 kN/m³
Solution
Bartleby Expert
by Bartleby Expert
SEE SOLUTION
Follow-up Question

I need detailed explanation to solve the exercise below. There are some formulas and hints, I also added some tables from the book.
Meyerhof's method, Coyle and Castello's method and Vesic's method were already solved.

A 20 m long concrete pile with a rectangular cross section of 460 mm × 460 mm fully embedded in sand is shown in
Figure P 12.2. Estimate the ultimate point load or tip resistance Qp by each of the following 4 methods and discuss.
Necessary variables and formulae:
Area of the pile tip
Effective vertical stress at the level of the pile tip
Atmospheric pressure 100 kN/m²
Ap
q'
Pa
o'o
Irr
Ir
A
Ms
Mean effective normal ground stress at the level of the pile point
Reduced rigidity index for the soil
Rigidity index for the soil
Average volumetric strain in the plastic zone below the pile point
Poisson's ratio of soil
1) Terzaghi's method (Use Ng
=
2) Meyerhof's method (Use Table 12.6 for interpolation of Na)
Sand: Qp = min (q', 0.5påtanp') · No Ap
3) Vesic's method (Use Table 12.8 for interpolation of N and modulus of elasticity of soil of Es = 600pa)
Sand: Qp = ¯'。No Ap
where ' =
0
exp[(37-4¹) tand
2
1-sin o'
1+2Ko
3
q', K. = 1 - sino', Irr
=
20 m
Ir
1+1,Δ
FIGURE P 12.2
9
Ir
=
For 25° ≤ ø' ≤ 45°, µs = 0.1 +0.3 (25¹), A = 0.005 (1 – $¹_25")
'-25°
q'
{
20°
20° Pa
Es
2(1+μ₂)q'tand'
4) Coyle and Castello's method (Use Figure 12.20 for extrapolation of Na)
Sand: Qp = q'N Ap
Concrete pile
460 mm X 460 mm
Loose sand
φί = 30°
y = 18.6 kN/m³
Dense sand
$'2 = 42°
y = 18.5 kN/m³
expand button
Transcribed Image Text:A 20 m long concrete pile with a rectangular cross section of 460 mm × 460 mm fully embedded in sand is shown in Figure P 12.2. Estimate the ultimate point load or tip resistance Qp by each of the following 4 methods and discuss. Necessary variables and formulae: Area of the pile tip Effective vertical stress at the level of the pile tip Atmospheric pressure 100 kN/m² Ap q' Pa o'o Irr Ir A Ms Mean effective normal ground stress at the level of the pile point Reduced rigidity index for the soil Rigidity index for the soil Average volumetric strain in the plastic zone below the pile point Poisson's ratio of soil 1) Terzaghi's method (Use Ng = 2) Meyerhof's method (Use Table 12.6 for interpolation of Na) Sand: Qp = min (q', 0.5påtanp') · No Ap 3) Vesic's method (Use Table 12.8 for interpolation of N and modulus of elasticity of soil of Es = 600pa) Sand: Qp = ¯'。No Ap where ' = 0 exp[(37-4¹) tand 2 1-sin o' 1+2Ko 3 q', K. = 1 - sino', Irr = 20 m Ir 1+1,Δ FIGURE P 12.2 9 Ir = For 25° ≤ ø' ≤ 45°, µs = 0.1 +0.3 (25¹), A = 0.005 (1 – $¹_25") '-25° q' { 20° 20° Pa Es 2(1+μ₂)q'tand' 4) Coyle and Castello's method (Use Figure 12.20 for extrapolation of Na) Sand: Qp = q'N Ap Concrete pile 460 mm X 460 mm Loose sand φί = 30° y = 18.6 kN/m³ Dense sand $'2 = 42° y = 18.5 kN/m³
TABLE 12.6 Interpolated Values of Ng Based on
Meyerhof's Theory
25
26
27
28
29
Soil friction angle, ø' (deg)
20
21
22
23
24
25
26
27
28
29
30
31
32
33
34
35
36
37
38
10
39
40
41
42
43
20
44
45
TABLE 12.8 Bearing Capacity Factors N. Based on the Theory of Expansion of Cavities
15.95
17.47
19.12
20.91
22.85
24.95
27.22
29.68
32.34
35.21
38.32
41.68
45.31
49.24
53.50
58.10
63.07
68.46
74.30
80.62
87.48
N₂
12.4
13.8
15.5
17.9
21.4
26.0
29.5
34.0
39.7
46.5
56.7
68.2
81.0
96.0
40
115.0
143.0
168.0
194.0
231.0
60
276.0
346.0
420.0
525.0
650.0
780.0
930.0
Embedment ratio, L/D
0
ITT
10
20
30
40
50
60
70
10
T
T
T
Bearing capacity factor, N*
9
20
40 60 80 100
$' = 30°
80
300
400
12.12
20.98
24.64
27.61
39.70
46.61
52.24
13.18
23.15
27.30
30.69
44.53
52.51
59.02
14.33
25.52
30.21
34.06
49.88
59.05
66.56
15.57
28.10
33.40
37.75
55.77
66.29
74.93
16.90
30.90
36.87
41.79
62.27
74.30
84.21
30
18.24
33.95
40.66
46.21
69.43
83.14
94.48
31
19.88
37.27
44.79
51.03
77.31
92.90
105.84
32
21.55
40.88
49.30
56.30
85.96
103.66
118.39
33
23.34
44.80
54.20
62.05
95.46
115.51
132.24
34
25.28
49.05
59.54
68.33
105.90
128.55
147.51
35
27.36
53.67
65.36
75.17
117.33
142.89
164.33
36
29.60
58.68
71.69
82.62
129.87
158.65
182.85
37
32.02
64.13
78.57
90.75
143.61
175.95
203.23
38
34.63
70.03
86.05
99.60
158.65
194.94
225.62
39
37.44
76.45
94.20
109.24
175.11
215.78
250.23
40
40.47
83.40
103.05
119.74
193.13
238.62
277.26
41
43.74
90.96
112.68
131.18
212.84
263.67
306.94
42
47.27
99.16
123.16
143.64
234.40
291.13
339.52
43
51.08
108.08
134.56
157.21
257.99
321.22
375.28
44
55.20
117.76
146.97
172.00
283.80
354.20
414.51
45
59.66
128.28
160.48
188.12
312.03
390.35
457.57
Based on data from "Design of Pile Foundations," by A. S. Vesic. Synthesis of Highway Practice by American Association of State Highway and Transportation, 1977
32° 36°
100
30.16
33.60
37.37
41.51
46.05
51.02
56.46
62.41
68.92
76.02
83.78
92.24
101.48
111.56
122.54
134.52
147.59
161.83
177.36
194.31
212.79
34°
FIGURE 12.20 Variation of N with L/D
(Based on Coyle and Castello, 1981)
38°
40°
200
200
500
57.06
64.62
73.04
82.40
92.80
104.33
117.11
131.24
146.87
164.12
183.16
204.14
227.26
252.71
280.71
311.50
345.34
382.53
423.39
468.28
517.58
expand button
Transcribed Image Text:TABLE 12.6 Interpolated Values of Ng Based on Meyerhof's Theory 25 26 27 28 29 Soil friction angle, ø' (deg) 20 21 22 23 24 25 26 27 28 29 30 31 32 33 34 35 36 37 38 10 39 40 41 42 43 20 44 45 TABLE 12.8 Bearing Capacity Factors N. Based on the Theory of Expansion of Cavities 15.95 17.47 19.12 20.91 22.85 24.95 27.22 29.68 32.34 35.21 38.32 41.68 45.31 49.24 53.50 58.10 63.07 68.46 74.30 80.62 87.48 N₂ 12.4 13.8 15.5 17.9 21.4 26.0 29.5 34.0 39.7 46.5 56.7 68.2 81.0 96.0 40 115.0 143.0 168.0 194.0 231.0 60 276.0 346.0 420.0 525.0 650.0 780.0 930.0 Embedment ratio, L/D 0 ITT 10 20 30 40 50 60 70 10 T T T Bearing capacity factor, N* 9 20 40 60 80 100 $' = 30° 80 300 400 12.12 20.98 24.64 27.61 39.70 46.61 52.24 13.18 23.15 27.30 30.69 44.53 52.51 59.02 14.33 25.52 30.21 34.06 49.88 59.05 66.56 15.57 28.10 33.40 37.75 55.77 66.29 74.93 16.90 30.90 36.87 41.79 62.27 74.30 84.21 30 18.24 33.95 40.66 46.21 69.43 83.14 94.48 31 19.88 37.27 44.79 51.03 77.31 92.90 105.84 32 21.55 40.88 49.30 56.30 85.96 103.66 118.39 33 23.34 44.80 54.20 62.05 95.46 115.51 132.24 34 25.28 49.05 59.54 68.33 105.90 128.55 147.51 35 27.36 53.67 65.36 75.17 117.33 142.89 164.33 36 29.60 58.68 71.69 82.62 129.87 158.65 182.85 37 32.02 64.13 78.57 90.75 143.61 175.95 203.23 38 34.63 70.03 86.05 99.60 158.65 194.94 225.62 39 37.44 76.45 94.20 109.24 175.11 215.78 250.23 40 40.47 83.40 103.05 119.74 193.13 238.62 277.26 41 43.74 90.96 112.68 131.18 212.84 263.67 306.94 42 47.27 99.16 123.16 143.64 234.40 291.13 339.52 43 51.08 108.08 134.56 157.21 257.99 321.22 375.28 44 55.20 117.76 146.97 172.00 283.80 354.20 414.51 45 59.66 128.28 160.48 188.12 312.03 390.35 457.57 Based on data from "Design of Pile Foundations," by A. S. Vesic. Synthesis of Highway Practice by American Association of State Highway and Transportation, 1977 32° 36° 100 30.16 33.60 37.37 41.51 46.05 51.02 56.46 62.41 68.92 76.02 83.78 92.24 101.48 111.56 122.54 134.52 147.59 161.83 177.36 194.31 212.79 34° FIGURE 12.20 Variation of N with L/D (Based on Coyle and Castello, 1981) 38° 40° 200 200 500 57.06 64.62 73.04 82.40 92.80 104.33 117.11 131.24 146.87 164.12 183.16 204.14 227.26 252.71 280.71 311.50 345.34 382.53 423.39 468.28 517.58
Solution
Bartleby Expert
by Bartleby Expert
SEE SOLUTION
Follow-up Question

I need detailed explanation to solve the exercise below. There are some formulas and hints, I also added some tables from the book.
Meyerhof's method, Coyle and Castello's method and Vesic's method were already solved.

TABLE 12.6 Interpolated Values of Ng Based on
Meyerhof's Theory
25
26
27
28
29
Soil friction angle, ø' (deg)
20
21
22
23
24
25
26
27
28
29
30
31
32
33
34
35
36
37
38
10
39
40
41
42
43
20
44
45
TABLE 12.8 Bearing Capacity Factors N. Based on the Theory of Expansion of Cavities
15.95
17.47
19.12
20.91
22.85
24.95
27.22
29.68
32.34
35.21
38.32
41.68
45.31
49.24
53.50
58.10
63.07
68.46
74.30
80.62
87.48
N₂
12.4
13.8
15.5
17.9
21.4
26.0
29.5
34.0
39.7
46.5
56.7
68.2
81.0
96.0
40
115.0
143.0
168.0
194.0
231.0
60
276.0
346.0
420.0
525.0
650.0
780.0
930.0
Embedment ratio, L/D
0
ITT
10
20
30
40
50
60
70
10
T
T
T
Bearing capacity factor, N*
9
20
40 60 80 100
$' = 30°
80
300
400
12.12
20.98
24.64
27.61
39.70
46.61
52.24
13.18
23.15
27.30
30.69
44.53
52.51
59.02
14.33
25.52
30.21
34.06
49.88
59.05
66.56
15.57
28.10
33.40
37.75
55.77
66.29
74.93
16.90
30.90
36.87
41.79
62.27
74.30
84.21
30
18.24
33.95
40.66
46.21
69.43
83.14
94.48
31
19.88
37.27
44.79
51.03
77.31
92.90
105.84
32
21.55
40.88
49.30
56.30
85.96
103.66
118.39
33
23.34
44.80
54.20
62.05
95.46
115.51
132.24
34
25.28
49.05
59.54
68.33
105.90
128.55
147.51
35
27.36
53.67
65.36
75.17
117.33
142.89
164.33
36
29.60
58.68
71.69
82.62
129.87
158.65
182.85
37
32.02
64.13
78.57
90.75
143.61
175.95
203.23
38
34.63
70.03
86.05
99.60
158.65
194.94
225.62
39
37.44
76.45
94.20
109.24
175.11
215.78
250.23
40
40.47
83.40
103.05
119.74
193.13
238.62
277.26
41
43.74
90.96
112.68
131.18
212.84
263.67
306.94
42
47.27
99.16
123.16
143.64
234.40
291.13
339.52
43
51.08
108.08
134.56
157.21
257.99
321.22
375.28
44
55.20
117.76
146.97
172.00
283.80
354.20
414.51
45
59.66
128.28
160.48
188.12
312.03
390.35
457.57
Based on data from "Design of Pile Foundations," by A. S. Vesic. Synthesis of Highway Practice by American Association of State Highway and Transportation, 1977
32° 36°
100
30.16
33.60
37.37
41.51
46.05
51.02
56.46
62.41
68.92
76.02
83.78
92.24
101.48
111.56
122.54
134.52
147.59
161.83
177.36
194.31
212.79
34°
FIGURE 12.20 Variation of N with L/D
(Based on Coyle and Castello, 1981)
38°
40°
200
200
500
57.06
64.62
73.04
82.40
92.80
104.33
117.11
131.24
146.87
164.12
183.16
204.14
227.26
252.71
280.71
311.50
345.34
382.53
423.39
468.28
517.58
expand button
Transcribed Image Text:TABLE 12.6 Interpolated Values of Ng Based on Meyerhof's Theory 25 26 27 28 29 Soil friction angle, ø' (deg) 20 21 22 23 24 25 26 27 28 29 30 31 32 33 34 35 36 37 38 10 39 40 41 42 43 20 44 45 TABLE 12.8 Bearing Capacity Factors N. Based on the Theory of Expansion of Cavities 15.95 17.47 19.12 20.91 22.85 24.95 27.22 29.68 32.34 35.21 38.32 41.68 45.31 49.24 53.50 58.10 63.07 68.46 74.30 80.62 87.48 N₂ 12.4 13.8 15.5 17.9 21.4 26.0 29.5 34.0 39.7 46.5 56.7 68.2 81.0 96.0 40 115.0 143.0 168.0 194.0 231.0 60 276.0 346.0 420.0 525.0 650.0 780.0 930.0 Embedment ratio, L/D 0 ITT 10 20 30 40 50 60 70 10 T T T Bearing capacity factor, N* 9 20 40 60 80 100 $' = 30° 80 300 400 12.12 20.98 24.64 27.61 39.70 46.61 52.24 13.18 23.15 27.30 30.69 44.53 52.51 59.02 14.33 25.52 30.21 34.06 49.88 59.05 66.56 15.57 28.10 33.40 37.75 55.77 66.29 74.93 16.90 30.90 36.87 41.79 62.27 74.30 84.21 30 18.24 33.95 40.66 46.21 69.43 83.14 94.48 31 19.88 37.27 44.79 51.03 77.31 92.90 105.84 32 21.55 40.88 49.30 56.30 85.96 103.66 118.39 33 23.34 44.80 54.20 62.05 95.46 115.51 132.24 34 25.28 49.05 59.54 68.33 105.90 128.55 147.51 35 27.36 53.67 65.36 75.17 117.33 142.89 164.33 36 29.60 58.68 71.69 82.62 129.87 158.65 182.85 37 32.02 64.13 78.57 90.75 143.61 175.95 203.23 38 34.63 70.03 86.05 99.60 158.65 194.94 225.62 39 37.44 76.45 94.20 109.24 175.11 215.78 250.23 40 40.47 83.40 103.05 119.74 193.13 238.62 277.26 41 43.74 90.96 112.68 131.18 212.84 263.67 306.94 42 47.27 99.16 123.16 143.64 234.40 291.13 339.52 43 51.08 108.08 134.56 157.21 257.99 321.22 375.28 44 55.20 117.76 146.97 172.00 283.80 354.20 414.51 45 59.66 128.28 160.48 188.12 312.03 390.35 457.57 Based on data from "Design of Pile Foundations," by A. S. Vesic. Synthesis of Highway Practice by American Association of State Highway and Transportation, 1977 32° 36° 100 30.16 33.60 37.37 41.51 46.05 51.02 56.46 62.41 68.92 76.02 83.78 92.24 101.48 111.56 122.54 134.52 147.59 161.83 177.36 194.31 212.79 34° FIGURE 12.20 Variation of N with L/D (Based on Coyle and Castello, 1981) 38° 40° 200 200 500 57.06 64.62 73.04 82.40 92.80 104.33 117.11 131.24 146.87 164.12 183.16 204.14 227.26 252.71 280.71 311.50 345.34 382.53 423.39 468.28 517.58
A 20 m long concrete pile with a rectangular cross section of 460 mm × 460 mm fully embedded in sand is shown in
Figure P 12.2. Estimate the ultimate point load or tip resistance Qp by each of the following 4 methods and discuss.
Necessary variables and formulae:
Area of the pile tip
Effective vertical stress at the level of the pile tip
Atmospheric pressure 100 kN/m²
Ap
q'
Pa
o'o
Irr
Ir
A
Ms
Mean effective normal ground stress at the level of the pile point
Reduced rigidity index for the soil
Rigidity index for the soil
Average volumetric strain in the plastic zone below the pile point
Poisson's ratio of soil
1) Terzaghi's method (Use Ng
=
2) Meyerhof's method (Use Table 12.6 for interpolation of Na)
Sand: Qp = min (q', 0.5påtanp') · No Ap
3) Vesic's method (Use Table 12.8 for interpolation of N and modulus of elasticity of soil of Es = 600pa)
Sand: Qp = ¯'。No Ap
where ' =
0
exp[(37-4¹) tand
2
1-sin o'
1+2Ko
3
q', K. = 1 - sino', Irr
=
20 m
Ir
1+1,Δ
FIGURE P 12.2
9
Ir
=
For 25° ≤ ø' ≤ 45°, µs = 0.1 +0.3 (25¹), A = 0.005 (1 – $¹_25")
'-25°
q'
{
20°
20° Pa
Es
2(1+μ₂)q'tand'
4) Coyle and Castello's method (Use Figure 12.20 for extrapolation of Na)
Sand: Qp = q'N Ap
Concrete pile
460 mm X 460 mm
Loose sand
φί = 30°
y = 18.6 kN/m³
Dense sand
$'2 = 42°
y = 18.5 kN/m³
expand button
Transcribed Image Text:A 20 m long concrete pile with a rectangular cross section of 460 mm × 460 mm fully embedded in sand is shown in Figure P 12.2. Estimate the ultimate point load or tip resistance Qp by each of the following 4 methods and discuss. Necessary variables and formulae: Area of the pile tip Effective vertical stress at the level of the pile tip Atmospheric pressure 100 kN/m² Ap q' Pa o'o Irr Ir A Ms Mean effective normal ground stress at the level of the pile point Reduced rigidity index for the soil Rigidity index for the soil Average volumetric strain in the plastic zone below the pile point Poisson's ratio of soil 1) Terzaghi's method (Use Ng = 2) Meyerhof's method (Use Table 12.6 for interpolation of Na) Sand: Qp = min (q', 0.5påtanp') · No Ap 3) Vesic's method (Use Table 12.8 for interpolation of N and modulus of elasticity of soil of Es = 600pa) Sand: Qp = ¯'。No Ap where ' = 0 exp[(37-4¹) tand 2 1-sin o' 1+2Ko 3 q', K. = 1 - sino', Irr = 20 m Ir 1+1,Δ FIGURE P 12.2 9 Ir = For 25° ≤ ø' ≤ 45°, µs = 0.1 +0.3 (25¹), A = 0.005 (1 – $¹_25") '-25° q' { 20° 20° Pa Es 2(1+μ₂)q'tand' 4) Coyle and Castello's method (Use Figure 12.20 for extrapolation of Na) Sand: Qp = q'N Ap Concrete pile 460 mm X 460 mm Loose sand φί = 30° y = 18.6 kN/m³ Dense sand $'2 = 42° y = 18.5 kN/m³
Solution
Bartleby Expert
by Bartleby Expert
SEE SOLUTION
Follow-up Question

I need detailed explanation to solve the exercise below. There are some formulas and hints, I also added some tables from the book.
Meyerhof's method, Coyle and Castello's method and Vesic's method were already solved.

A 20 m long concrete pile with a rectangular cross section of 460 mm × 460 mm fully embedded in sand is shown in
Figure P 12.2. Estimate the ultimate point load or tip resistance Qp by each of the following 4 methods and discuss.
Necessary variables and formulae:
Area of the pile tip
Effective vertical stress at the level of the pile tip
Atmospheric pressure 100 kN/m²
Ap
q'
Pa
o'o
Irr
Ir
A
Ms
Mean effective normal ground stress at the level of the pile point
Reduced rigidity index for the soil
Rigidity index for the soil
Average volumetric strain in the plastic zone below the pile point
Poisson's ratio of soil
1) Terzaghi's method (Use Ng
=
2) Meyerhof's method (Use Table 12.6 for interpolation of Na)
Sand: Qp = min (q', 0.5påtanp') · No Ap
3) Vesic's method (Use Table 12.8 for interpolation of N and modulus of elasticity of soil of Es = 600pa)
Sand: Qp = ¯'。No Ap
where ' =
0
exp[(37-4¹) tand
2
1-sin o'
1+2Ko
3
q', K. = 1 - sino', Irr
=
20 m
Ir
1+1,Δ
FIGURE P 12.2
9
Ir
=
For 25° ≤ ø' ≤ 45°, µs = 0.1 +0.3 (25¹), A = 0.005 (1 – $¹_25")
'-25°
q'
{
20°
20° Pa
Es
2(1+μ₂)q'tand'
4) Coyle and Castello's method (Use Figure 12.20 for extrapolation of Na)
Sand: Qp = q'N Ap
Concrete pile
460 mm X 460 mm
Loose sand
φί = 30°
y = 18.6 kN/m³
Dense sand
$'2 = 42°
y = 18.5 kN/m³
expand button
Transcribed Image Text:A 20 m long concrete pile with a rectangular cross section of 460 mm × 460 mm fully embedded in sand is shown in Figure P 12.2. Estimate the ultimate point load or tip resistance Qp by each of the following 4 methods and discuss. Necessary variables and formulae: Area of the pile tip Effective vertical stress at the level of the pile tip Atmospheric pressure 100 kN/m² Ap q' Pa o'o Irr Ir A Ms Mean effective normal ground stress at the level of the pile point Reduced rigidity index for the soil Rigidity index for the soil Average volumetric strain in the plastic zone below the pile point Poisson's ratio of soil 1) Terzaghi's method (Use Ng = 2) Meyerhof's method (Use Table 12.6 for interpolation of Na) Sand: Qp = min (q', 0.5påtanp') · No Ap 3) Vesic's method (Use Table 12.8 for interpolation of N and modulus of elasticity of soil of Es = 600pa) Sand: Qp = ¯'。No Ap where ' = 0 exp[(37-4¹) tand 2 1-sin o' 1+2Ko 3 q', K. = 1 - sino', Irr = 20 m Ir 1+1,Δ FIGURE P 12.2 9 Ir = For 25° ≤ ø' ≤ 45°, µs = 0.1 +0.3 (25¹), A = 0.005 (1 – $¹_25") '-25° q' { 20° 20° Pa Es 2(1+μ₂)q'tand' 4) Coyle and Castello's method (Use Figure 12.20 for extrapolation of Na) Sand: Qp = q'N Ap Concrete pile 460 mm X 460 mm Loose sand φί = 30° y = 18.6 kN/m³ Dense sand $'2 = 42° y = 18.5 kN/m³
TABLE 12.6 Interpolated Values of Ng Based on
Meyerhof's Theory
25
26
27
28
29
Soil friction angle, ø' (deg)
20
21
22
23
24
25
26
27
28
29
30
31
32
33
34
35
36
37
38
10
39
40
41
42
43
20
44
45
TABLE 12.8 Bearing Capacity Factors N. Based on the Theory of Expansion of Cavities
15.95
17.47
19.12
20.91
22.85
24.95
27.22
29.68
32.34
35.21
38.32
41.68
45.31
49.24
53.50
58.10
63.07
68.46
74.30
80.62
87.48
N₂
12.4
13.8
15.5
17.9
21.4
26.0
29.5
34.0
39.7
46.5
56.7
68.2
81.0
96.0
40
115.0
143.0
168.0
194.0
231.0
60
276.0
346.0
420.0
525.0
650.0
780.0
930.0
Embedment ratio, L/D
0
ITT
10
20
30
40
50
60
70
10
T
T
T
Bearing capacity factor, N*
9
20
40 60 80 100
$' = 30°
80
300
400
12.12
20.98
24.64
27.61
39.70
46.61
52.24
13.18
23.15
27.30
30.69
44.53
52.51
59.02
14.33
25.52
30.21
34.06
49.88
59.05
66.56
15.57
28.10
33.40
37.75
55.77
66.29
74.93
16.90
30.90
36.87
41.79
62.27
74.30
84.21
30
18.24
33.95
40.66
46.21
69.43
83.14
94.48
31
19.88
37.27
44.79
51.03
77.31
92.90
105.84
32
21.55
40.88
49.30
56.30
85.96
103.66
118.39
33
23.34
44.80
54.20
62.05
95.46
115.51
132.24
34
25.28
49.05
59.54
68.33
105.90
128.55
147.51
35
27.36
53.67
65.36
75.17
117.33
142.89
164.33
36
29.60
58.68
71.69
82.62
129.87
158.65
182.85
37
32.02
64.13
78.57
90.75
143.61
175.95
203.23
38
34.63
70.03
86.05
99.60
158.65
194.94
225.62
39
37.44
76.45
94.20
109.24
175.11
215.78
250.23
40
40.47
83.40
103.05
119.74
193.13
238.62
277.26
41
43.74
90.96
112.68
131.18
212.84
263.67
306.94
42
47.27
99.16
123.16
143.64
234.40
291.13
339.52
43
51.08
108.08
134.56
157.21
257.99
321.22
375.28
44
55.20
117.76
146.97
172.00
283.80
354.20
414.51
45
59.66
128.28
160.48
188.12
312.03
390.35
457.57
Based on data from "Design of Pile Foundations," by A. S. Vesic. Synthesis of Highway Practice by American Association of State Highway and Transportation, 1977
32° 36°
100
30.16
33.60
37.37
41.51
46.05
51.02
56.46
62.41
68.92
76.02
83.78
92.24
101.48
111.56
122.54
134.52
147.59
161.83
177.36
194.31
212.79
34°
FIGURE 12.20 Variation of N with L/D
(Based on Coyle and Castello, 1981)
38°
40°
200
200
500
57.06
64.62
73.04
82.40
92.80
104.33
117.11
131.24
146.87
164.12
183.16
204.14
227.26
252.71
280.71
311.50
345.34
382.53
423.39
468.28
517.58
expand button
Transcribed Image Text:TABLE 12.6 Interpolated Values of Ng Based on Meyerhof's Theory 25 26 27 28 29 Soil friction angle, ø' (deg) 20 21 22 23 24 25 26 27 28 29 30 31 32 33 34 35 36 37 38 10 39 40 41 42 43 20 44 45 TABLE 12.8 Bearing Capacity Factors N. Based on the Theory of Expansion of Cavities 15.95 17.47 19.12 20.91 22.85 24.95 27.22 29.68 32.34 35.21 38.32 41.68 45.31 49.24 53.50 58.10 63.07 68.46 74.30 80.62 87.48 N₂ 12.4 13.8 15.5 17.9 21.4 26.0 29.5 34.0 39.7 46.5 56.7 68.2 81.0 96.0 40 115.0 143.0 168.0 194.0 231.0 60 276.0 346.0 420.0 525.0 650.0 780.0 930.0 Embedment ratio, L/D 0 ITT 10 20 30 40 50 60 70 10 T T T Bearing capacity factor, N* 9 20 40 60 80 100 $' = 30° 80 300 400 12.12 20.98 24.64 27.61 39.70 46.61 52.24 13.18 23.15 27.30 30.69 44.53 52.51 59.02 14.33 25.52 30.21 34.06 49.88 59.05 66.56 15.57 28.10 33.40 37.75 55.77 66.29 74.93 16.90 30.90 36.87 41.79 62.27 74.30 84.21 30 18.24 33.95 40.66 46.21 69.43 83.14 94.48 31 19.88 37.27 44.79 51.03 77.31 92.90 105.84 32 21.55 40.88 49.30 56.30 85.96 103.66 118.39 33 23.34 44.80 54.20 62.05 95.46 115.51 132.24 34 25.28 49.05 59.54 68.33 105.90 128.55 147.51 35 27.36 53.67 65.36 75.17 117.33 142.89 164.33 36 29.60 58.68 71.69 82.62 129.87 158.65 182.85 37 32.02 64.13 78.57 90.75 143.61 175.95 203.23 38 34.63 70.03 86.05 99.60 158.65 194.94 225.62 39 37.44 76.45 94.20 109.24 175.11 215.78 250.23 40 40.47 83.40 103.05 119.74 193.13 238.62 277.26 41 43.74 90.96 112.68 131.18 212.84 263.67 306.94 42 47.27 99.16 123.16 143.64 234.40 291.13 339.52 43 51.08 108.08 134.56 157.21 257.99 321.22 375.28 44 55.20 117.76 146.97 172.00 283.80 354.20 414.51 45 59.66 128.28 160.48 188.12 312.03 390.35 457.57 Based on data from "Design of Pile Foundations," by A. S. Vesic. Synthesis of Highway Practice by American Association of State Highway and Transportation, 1977 32° 36° 100 30.16 33.60 37.37 41.51 46.05 51.02 56.46 62.41 68.92 76.02 83.78 92.24 101.48 111.56 122.54 134.52 147.59 161.83 177.36 194.31 212.79 34° FIGURE 12.20 Variation of N with L/D (Based on Coyle and Castello, 1981) 38° 40° 200 200 500 57.06 64.62 73.04 82.40 92.80 104.33 117.11 131.24 146.87 164.12 183.16 204.14 227.26 252.71 280.71 311.50 345.34 382.53 423.39 468.28 517.58
Solution
Bartleby Expert
by Bartleby Expert
SEE SOLUTION
Follow-up Question

I need detailed explanation to solve the exercise below. There are some formulas and hints, I also added some tables from the book.
Meyerhof's method, Coyle and Castello's method and Vesic's method were already solved.

A 20 m long concrete pile with a rectangular cross section of 460 mm × 460 mm fully embedded in sand is shown in
Figure P 12.2. Estimate the ultimate point load or tip resistance Qp by each of the following 4 methods and discuss.
Necessary variables and formulae:
Area of the pile tip
Effective vertical stress at the level of the pile tip
Atmospheric pressure 100 kN/m²
Ap
q'
Pa
o'o
Irr
Ir
A
Ms
Mean effective normal ground stress at the level of the pile point
Reduced rigidity index for the soil
Rigidity index for the soil
Average volumetric strain in the plastic zone below the pile point
Poisson's ratio of soil
1) Terzaghi's method (Use Ng
=
2) Meyerhof's method (Use Table 12.6 for interpolation of Na)
Sand: Qp = min (q', 0.5påtanp') · No Ap
3) Vesic's method (Use Table 12.8 for interpolation of N and modulus of elasticity of soil of Es = 600pa)
Sand: Qp = ¯'。No Ap
where ' =
0
exp[(37-4¹) tand
2
1-sin o'
1+2Ko
3
q', K. = 1 - sino', Irr
=
20 m
Ir
1+1,Δ
FIGURE P 12.2
9
Ir
=
For 25° ≤ ø' ≤ 45°, µs = 0.1 +0.3 (25¹), A = 0.005 (1 – $¹_25")
'-25°
q'
{
20°
20° Pa
Es
2(1+μ₂)q'tand'
4) Coyle and Castello's method (Use Figure 12.20 for extrapolation of Na)
Sand: Qp = q'N Ap
Concrete pile
460 mm X 460 mm
Loose sand
φί = 30°
y = 18.6 kN/m³
Dense sand
$'2 = 42°
y = 18.5 kN/m³
expand button
Transcribed Image Text:A 20 m long concrete pile with a rectangular cross section of 460 mm × 460 mm fully embedded in sand is shown in Figure P 12.2. Estimate the ultimate point load or tip resistance Qp by each of the following 4 methods and discuss. Necessary variables and formulae: Area of the pile tip Effective vertical stress at the level of the pile tip Atmospheric pressure 100 kN/m² Ap q' Pa o'o Irr Ir A Ms Mean effective normal ground stress at the level of the pile point Reduced rigidity index for the soil Rigidity index for the soil Average volumetric strain in the plastic zone below the pile point Poisson's ratio of soil 1) Terzaghi's method (Use Ng = 2) Meyerhof's method (Use Table 12.6 for interpolation of Na) Sand: Qp = min (q', 0.5påtanp') · No Ap 3) Vesic's method (Use Table 12.8 for interpolation of N and modulus of elasticity of soil of Es = 600pa) Sand: Qp = ¯'。No Ap where ' = 0 exp[(37-4¹) tand 2 1-sin o' 1+2Ko 3 q', K. = 1 - sino', Irr = 20 m Ir 1+1,Δ FIGURE P 12.2 9 Ir = For 25° ≤ ø' ≤ 45°, µs = 0.1 +0.3 (25¹), A = 0.005 (1 – $¹_25") '-25° q' { 20° 20° Pa Es 2(1+μ₂)q'tand' 4) Coyle and Castello's method (Use Figure 12.20 for extrapolation of Na) Sand: Qp = q'N Ap Concrete pile 460 mm X 460 mm Loose sand φί = 30° y = 18.6 kN/m³ Dense sand $'2 = 42° y = 18.5 kN/m³
TABLE 12.6 Interpolated Values of Ng Based on
Meyerhof's Theory
25
26
27
28
29
Soil friction angle, ø' (deg)
20
21
22
23
24
25
26
27
28
29
30
31
32
33
34
35
36
37
38
10
39
40
41
42
43
20
44
45
TABLE 12.8 Bearing Capacity Factors N. Based on the Theory of Expansion of Cavities
15.95
17.47
19.12
20.91
22.85
24.95
27.22
29.68
32.34
35.21
38.32
41.68
45.31
49.24
53.50
58.10
63.07
68.46
74.30
80.62
87.48
N₂
12.4
13.8
15.5
17.9
21.4
26.0
29.5
34.0
39.7
46.5
56.7
68.2
81.0
96.0
40
115.0
143.0
168.0
194.0
231.0
60
276.0
346.0
420.0
525.0
650.0
780.0
930.0
Embedment ratio, L/D
0
ITT
10
20
30
40
50
60
70
10
T
T
T
Bearing capacity factor, N*
9
20
40 60 80 100
$' = 30°
80
300
400
12.12
20.98
24.64
27.61
39.70
46.61
52.24
13.18
23.15
27.30
30.69
44.53
52.51
59.02
14.33
25.52
30.21
34.06
49.88
59.05
66.56
15.57
28.10
33.40
37.75
55.77
66.29
74.93
16.90
30.90
36.87
41.79
62.27
74.30
84.21
30
18.24
33.95
40.66
46.21
69.43
83.14
94.48
31
19.88
37.27
44.79
51.03
77.31
92.90
105.84
32
21.55
40.88
49.30
56.30
85.96
103.66
118.39
33
23.34
44.80
54.20
62.05
95.46
115.51
132.24
34
25.28
49.05
59.54
68.33
105.90
128.55
147.51
35
27.36
53.67
65.36
75.17
117.33
142.89
164.33
36
29.60
58.68
71.69
82.62
129.87
158.65
182.85
37
32.02
64.13
78.57
90.75
143.61
175.95
203.23
38
34.63
70.03
86.05
99.60
158.65
194.94
225.62
39
37.44
76.45
94.20
109.24
175.11
215.78
250.23
40
40.47
83.40
103.05
119.74
193.13
238.62
277.26
41
43.74
90.96
112.68
131.18
212.84
263.67
306.94
42
47.27
99.16
123.16
143.64
234.40
291.13
339.52
43
51.08
108.08
134.56
157.21
257.99
321.22
375.28
44
55.20
117.76
146.97
172.00
283.80
354.20
414.51
45
59.66
128.28
160.48
188.12
312.03
390.35
457.57
Based on data from "Design of Pile Foundations," by A. S. Vesic. Synthesis of Highway Practice by American Association of State Highway and Transportation, 1977
32° 36°
100
30.16
33.60
37.37
41.51
46.05
51.02
56.46
62.41
68.92
76.02
83.78
92.24
101.48
111.56
122.54
134.52
147.59
161.83
177.36
194.31
212.79
34°
FIGURE 12.20 Variation of N with L/D
(Based on Coyle and Castello, 1981)
38°
40°
200
200
500
57.06
64.62
73.04
82.40
92.80
104.33
117.11
131.24
146.87
164.12
183.16
204.14
227.26
252.71
280.71
311.50
345.34
382.53
423.39
468.28
517.58
expand button
Transcribed Image Text:TABLE 12.6 Interpolated Values of Ng Based on Meyerhof's Theory 25 26 27 28 29 Soil friction angle, ø' (deg) 20 21 22 23 24 25 26 27 28 29 30 31 32 33 34 35 36 37 38 10 39 40 41 42 43 20 44 45 TABLE 12.8 Bearing Capacity Factors N. Based on the Theory of Expansion of Cavities 15.95 17.47 19.12 20.91 22.85 24.95 27.22 29.68 32.34 35.21 38.32 41.68 45.31 49.24 53.50 58.10 63.07 68.46 74.30 80.62 87.48 N₂ 12.4 13.8 15.5 17.9 21.4 26.0 29.5 34.0 39.7 46.5 56.7 68.2 81.0 96.0 40 115.0 143.0 168.0 194.0 231.0 60 276.0 346.0 420.0 525.0 650.0 780.0 930.0 Embedment ratio, L/D 0 ITT 10 20 30 40 50 60 70 10 T T T Bearing capacity factor, N* 9 20 40 60 80 100 $' = 30° 80 300 400 12.12 20.98 24.64 27.61 39.70 46.61 52.24 13.18 23.15 27.30 30.69 44.53 52.51 59.02 14.33 25.52 30.21 34.06 49.88 59.05 66.56 15.57 28.10 33.40 37.75 55.77 66.29 74.93 16.90 30.90 36.87 41.79 62.27 74.30 84.21 30 18.24 33.95 40.66 46.21 69.43 83.14 94.48 31 19.88 37.27 44.79 51.03 77.31 92.90 105.84 32 21.55 40.88 49.30 56.30 85.96 103.66 118.39 33 23.34 44.80 54.20 62.05 95.46 115.51 132.24 34 25.28 49.05 59.54 68.33 105.90 128.55 147.51 35 27.36 53.67 65.36 75.17 117.33 142.89 164.33 36 29.60 58.68 71.69 82.62 129.87 158.65 182.85 37 32.02 64.13 78.57 90.75 143.61 175.95 203.23 38 34.63 70.03 86.05 99.60 158.65 194.94 225.62 39 37.44 76.45 94.20 109.24 175.11 215.78 250.23 40 40.47 83.40 103.05 119.74 193.13 238.62 277.26 41 43.74 90.96 112.68 131.18 212.84 263.67 306.94 42 47.27 99.16 123.16 143.64 234.40 291.13 339.52 43 51.08 108.08 134.56 157.21 257.99 321.22 375.28 44 55.20 117.76 146.97 172.00 283.80 354.20 414.51 45 59.66 128.28 160.48 188.12 312.03 390.35 457.57 Based on data from "Design of Pile Foundations," by A. S. Vesic. Synthesis of Highway Practice by American Association of State Highway and Transportation, 1977 32° 36° 100 30.16 33.60 37.37 41.51 46.05 51.02 56.46 62.41 68.92 76.02 83.78 92.24 101.48 111.56 122.54 134.52 147.59 161.83 177.36 194.31 212.79 34° FIGURE 12.20 Variation of N with L/D (Based on Coyle and Castello, 1981) 38° 40° 200 200 500 57.06 64.62 73.04 82.40 92.80 104.33 117.11 131.24 146.87 164.12 183.16 204.14 227.26 252.71 280.71 311.50 345.34 382.53 423.39 468.28 517.58
Solution
Bartleby Expert
by Bartleby Expert
SEE SOLUTION
Knowledge Booster
Background pattern image
Civil Engineering
Learn more about
Need a deep-dive on the concept behind this application? Look no further. Learn more about this topic, civil-engineering and related others by exploring similar questions and additional content below.
Similar questions
Recommended textbooks for you
Text book image
Structural Analysis
Civil Engineering
ISBN:9781337630931
Author:KASSIMALI, Aslam.
Publisher:Cengage,
Text book image
Structural Analysis (10th Edition)
Civil Engineering
ISBN:9780134610672
Author:Russell C. Hibbeler
Publisher:PEARSON
Text book image
Principles of Foundation Engineering (MindTap Cou...
Civil Engineering
ISBN:9781337705028
Author:Braja M. Das, Nagaratnam Sivakugan
Publisher:Cengage Learning
Text book image
Fundamentals of Structural Analysis
Civil Engineering
ISBN:9780073398006
Author:Kenneth M. Leet Emeritus, Chia-Ming Uang, Joel Lanning
Publisher:McGraw-Hill Education
Text book image
Sustainable Energy
Civil Engineering
ISBN:9781337551663
Author:DUNLAP, Richard A.
Publisher:Cengage,
Text book image
Traffic and Highway Engineering
Civil Engineering
ISBN:9781305156241
Author:Garber, Nicholas J.
Publisher:Cengage Learning