MATLAB: An Introduction with Applications
6th Edition
ISBN: 9781119256830
Author: Amos Gilat
Publisher: John Wiley & Sons Inc
expand_more
expand_more
format_list_bulleted
Question

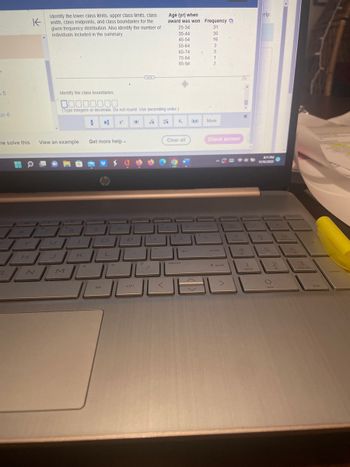
Transcribed Image Text:This educational exercise focuses on analyzing a frequency distribution related to ages at which awards were won. The task is to identify the lower class limits, upper class limits, class width, class midpoints, and class boundaries. Additionally, the total number of individuals included in the summary should be determined.
Data table:
- **Age (yr) when award was won**
- 25-34: Frequency = 31
- 35-44: Frequency = 35
- 45-54: Frequency = 16
- 55-64: Frequency = 5
- 65-74: Frequency = 2
- 75-84: Frequency = 2
- 85-94: Frequency = 1
### Steps for Analysis:
1. **Lower and Upper Class Limits:**
- Identify the smallest and largest values in each age range.
2. **Class Width:**
- Calculate by subtracting the lower limit of one class from the lower limit of the subsequent class.
3. **Class Midpoints:**
- Determine by averaging the lower and upper limits of each class.
4. **Class Boundaries:**
- Establish by averaging the upper limit of a class and the lower limit of the next class to avoid gaps between classes.
5. **Total Number of Individuals:**
- Add the frequencies from all classes to calculate the total number of individuals represented in the data.
This breakdown will help in interpreting demographic trends and patterns related to age and award-winning occurrences.
Expert Solution
This question has been solved!
Explore an expertly crafted, step-by-step solution for a thorough understanding of key concepts.
Step by stepSolved in 2 steps with 1 images

Knowledge Booster
Similar questions
- Below are the times (in days) it takes for a sample of 22 customers from Jack's computer store to pay their invoices. 19, 15, 43, 39, 35, 31, 27, 22, 18, 14, 42, 38, 13, 13, 41, 41, 37, 37, 37, 33, 33, 33 Send data to calculator Draw the frequency polygon for these data using an initial class boundary of 12.5 and a class width of 7. Note that you can add or remove classes from the figure. Label each class with its midpoint. Frequency 7. Check 26°F Clear Q Search 0:00 00:0 X Save For Later C Submit Assignmearrow_forwardStep 3 of 5 2/21 Correct Scores on a Test Class Frequency 50-57 14 58-65 66-73 10 74-81 8 82-89 9 Step 3 of 5: Determine the class width of each class. 囲 Tak Answerarrow_forwardIs this correctarrow_forward
arrow_back_ios
arrow_forward_ios
Recommended textbooks for you
 MATLAB: An Introduction with ApplicationsStatisticsISBN:9781119256830Author:Amos GilatPublisher:John Wiley & Sons Inc
 Probability and Statistics for Engineering and th...StatisticsISBN:9781305251809Author:Jay L. DevorePublisher:Cengage Learning
 Statistics for The Behavioral Sciences (MindTap C...StatisticsISBN:9781305504912Author:Frederick J Gravetter, Larry B. WallnauPublisher:Cengage Learning
 Elementary Statistics: Picturing the World (7th E...StatisticsISBN:9780134683416Author:Ron Larson, Betsy FarberPublisher:PEARSON
 The Basic Practice of StatisticsStatisticsISBN:9781319042578Author:David S. Moore, William I. Notz, Michael A. FlignerPublisher:W. H. Freeman
 Introduction to the Practice of StatisticsStatisticsISBN:9781319013387Author:David S. Moore, George P. McCabe, Bruce A. CraigPublisher:W. H. Freeman

MATLAB: An Introduction with Applications
Statistics
ISBN:9781119256830
Author:Amos Gilat
Publisher:John Wiley & Sons Inc

Probability and Statistics for Engineering and th...
Statistics
ISBN:9781305251809
Author:Jay L. Devore
Publisher:Cengage Learning

Statistics for The Behavioral Sciences (MindTap C...
Statistics
ISBN:9781305504912
Author:Frederick J Gravetter, Larry B. Wallnau
Publisher:Cengage Learning

Elementary Statistics: Picturing the World (7th E...
Statistics
ISBN:9780134683416
Author:Ron Larson, Betsy Farber
Publisher:PEARSON

The Basic Practice of Statistics
Statistics
ISBN:9781319042578
Author:David S. Moore, William I. Notz, Michael A. Fligner
Publisher:W. H. Freeman

Introduction to the Practice of Statistics
Statistics
ISBN:9781319013387
Author:David S. Moore, George P. McCabe, Bruce A. Craig
Publisher:W. H. Freeman